Categories
Real Estate Market

3 Graphs To Show This Isn’t a Housing Bubble

3 Graphs To Show This Isn’t a Housing Bubble

With all the headlines and buzz in the media, some consumers believe the market is in a housing bubble. As the housing market shifts, you may be wondering what’ll happen next. It’s only natural for concerns to creep in that it could be a repeat of what took place in 2008. The good news is, there’s concrete data to show why this is nothing like the last time.

There’s a Shortage of Homes on the Market Today, Not a Surplus

The supply of inventory needed to sustain a normal real estate market is approximately six months. Anything more than that is an overabundance and will causes prices to depreciate. Anything less than that is a shortage and will lead to continued price appreciation.

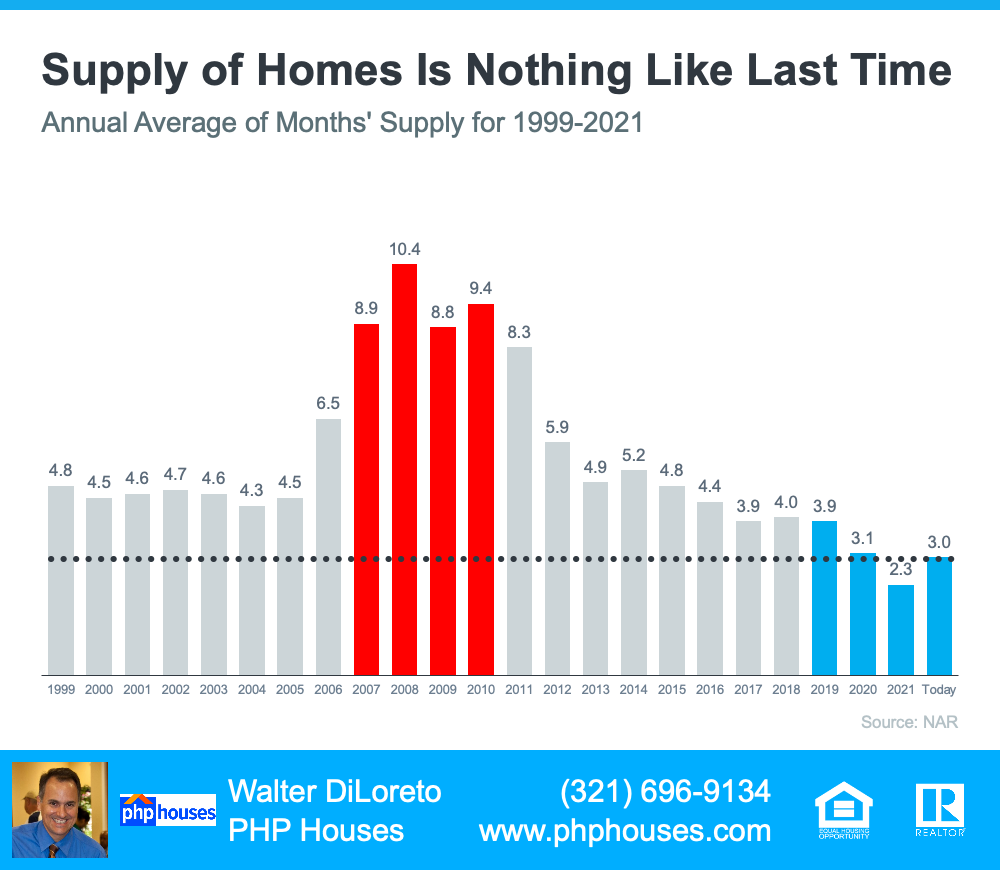
For historical context, there were too many homes for sale during the housing crisis (many of which were short sales and foreclosures), and that caused prices to tumble. Today, supply is growing, but there’s still a shortage of inventory available.

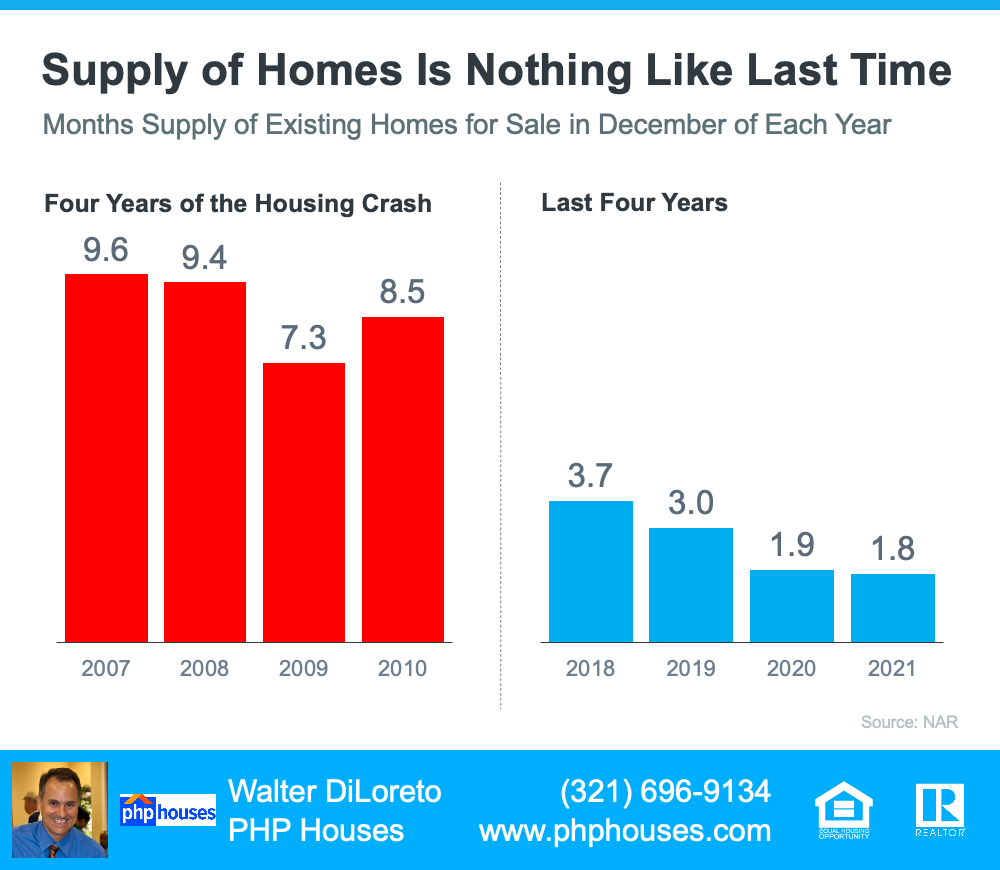
The graph below uses data from the National Association of Realtors (NAR) to show how this time compares to the crash. Today, unsold inventory sits at just a 3.0-months’ supply at the current sales pace.
Graphs
Supply of Homes Is Nothing Like Last Time

One of the reasons inventory is still low is because of sustained underbuilding. When you couple that with ongoing buyer demand as millennials age into their peak homebuying years, it continues to put upward pressure on home prices. That limited supply compared to buyer demand is why experts forecast home prices won’t fall this time.

Mortgage Standards Were Much More Relaxed During the Crash

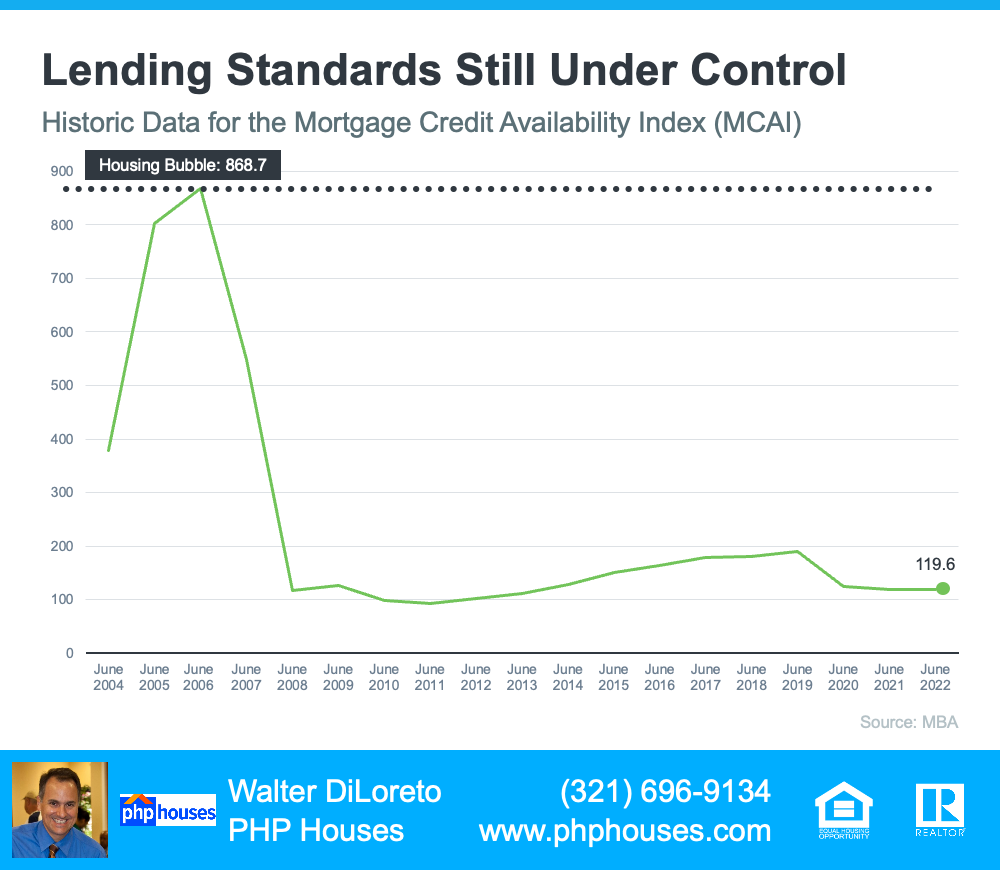
During the lead-up to the housing crisis, it was much easier to get a home loan than it is today. The graph below showcases data on the Mortgage Credit Availability Index (MCAI) from the Mortgage Bankers Association(MBA). The higher the number, the easier it is to get a mortgage.
Graphs
Lending Standards Still Under Control

Running up to 2006, banks were creating artificial demand by lowering lending standards and making it easy for just about anyone to qualify for a home loan or refinance their current home. Back then, lending institutions took on much greater risk in both the person and the mortgage products offered. That led to mass defaults, foreclosures, and falling prices.

Today, things are different, and purchasers face much higher standards from mortgage companies. Mark Fleming, Chief Economist at First American, says:

Credit standards tightened in recent months due to increasing economic uncertainty and monetary policy tightening.” 

Stricter standards, like there are today, help prevent a risk of a rash of foreclosures like there was last time.

The Foreclosure Volume Is Nothing Like It Was During the Crash

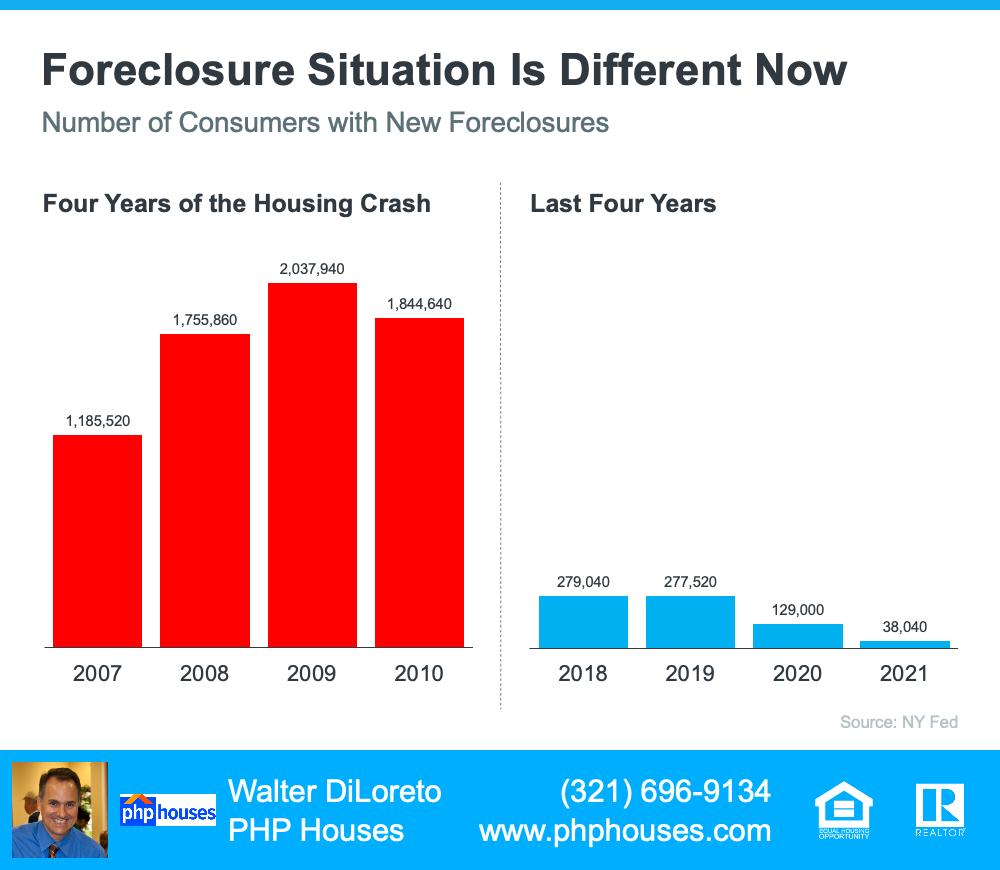
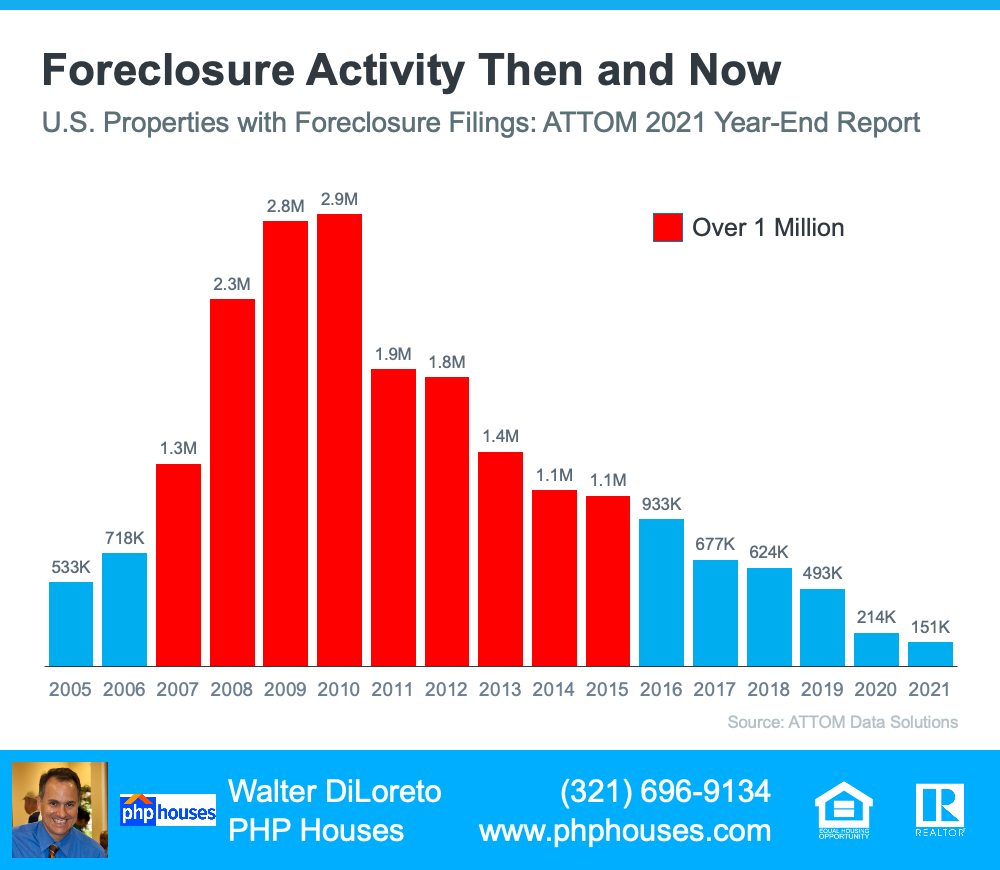
The most obvious difference is the number of homeowners that were facing foreclosure after the housing bubble burst. Foreclosure activity has been on the way down since the crash because buyers today are more qualified and less likely to default on their loans. The graph below uses data from ATTOM Data Solutions to help tell the story:
Graphs
Foreclosure Activity Then and Now

In addition, homeowners today are equity rich, not tapped out. In the run-up to the housing bubble, some homeowners were using their homes as personal ATMs. Many immediately withdrew their equity once it built up. When home values began to fall, some homeowners found themselves in a negative equity situation where the amount they owed on their mortgage was greater than the value of their home. Some of those households decided to walk away from their homes, and that led to a wave of distressed property listings (foreclosures and short sales), which sold at considerable discounts that lowered the value of other homes in the area.

Today, prices have risen nicely over the last few years, and that’s given homeowners an equity boost. According to Black Knight:

In total, mortgage holders gained $2.8 trillion in tappable equity over the past 12 months – a 34% increase that equates to more than $207,000 in equity available per borrower. . . .”

With the average home equity now standing at $207,000, homeowners are in a completely different position this time.

Bottom Line

If you’re worried we’re making the same mistakes that led to the housing crash, the graphs above should help alleviate your concerns. Concrete data and expert insights clearly show why this is nothing like the last time.

Contact us:
PHP Houses
142 W Lakeview Ave
Unit 1030
Lake Mary, FL 32746
Ph: (407) 519-0719
Fax: (407) 205-1951
email: info@phphouses.com

Let’s Connect:
Facebook
Linkedin
Twitter
Instagram

The information contained, and the opinions expressed, in this article are not intended to be construed as investment advice. The author does not guarantee or warrant the accuracy or completeness of the information or opinions contained herein. Nothing herein should be construed as investment advice. You should always conduct your own research and due diligence and obtain professional advice before making any investment decision. The author will not be liable for any loss or damage caused by your reliance on the information or opinions contained herein.


Categories
Real Estate Market

Housing Experts Say This Isn’t a Bubble

Housing Experts Say This Isn’t a Bubble

With so much talk about an economic slowdown, some people are asking if the housing market is heading for a crash like the one in 2008. To really understand what’s happening with real estate today, it’s important to lean on the experts for reliable information.

Here’s why economists and industry experts say the housing market is not a bubble ready to pop.

Today Is Nothing Like 2008

The 2008 housing crash is still fresh in the minds of many homebuyers and sellers. But today’s market is different. Odeta Kushi, Deputy Chief Economist at First American, says:

“This is not the same market of 2008. . . . It’s no secret the housing market played a central role in the Great Recession, but this market is just fundamentally different in so many ways.”

Natalie Campisi, Advisor Staff for Forbes, explains how today’s lending standards are different than those during the lead-up to the housing market crash:

“Among the differences between today’s housing market and that of the 2008 housing crash is that lending standards are tighter due to lessons learned and new regulations enacted after the last crisis. Essentially, that means those approved for a mortgage nowadays are less likely to default than those who were approved in the pre-crisis lending period.”

Another reason today’s housing market is nothing like 2008 is that the number of people looking to buy a home still outweighs the supply of homes for sale. As realtor.com notes:

. . . experts don’t believe the market is in a bubble or a crash is in the cards, like during the Great Recession. The nation is still suffering from a housing shortage that has reached crisis proportions at a time when many millennials are reaching the age when they start to consider homeownership. That’s likely to keep prices high.”

Bottom Line

Experts say the housing market isn’t a bubble, and we’re not heading for a crash. Let’s connect so you can have a full picture of today’s housing market in our local area.

Contact us:
PHP Houses
142 W Lakeview Ave
Unit 1030
Lake Mary, FL 32746
Ph: (407) 519-0719
Fax: (407) 205-1951
email: info@phphouses.com

Let’s Connect:
Facebook
Linkedin
Twitter
Instagram

The information contained, and the opinions expressed, in this article are not intended to be construed as investment advice. The author does not guarantee or warrant the accuracy or completeness of the information or opinions contained herein. Nothing herein should be construed as investment advice. You should always conduct your own research and due diligence and obtain professional advice before making any investment decision. The author will not be liable for any loss or damage caused by your reliance on the information or opinions contained herein.
 

Categories
Real Estate Market

Is the Housing Market Correcting?

Is the Housing Market Correcting?

If you’re following the news, all of the headlines about conditions in the current housing market may leave you with more questions than answers. Is the boom over? Is the market crashing or correcting?Here’s what you need to know.

The housing market is moderating compared to the last two years, but what everyone needs to remember is that the past two years were record-breaking in nearly every way. Record-low mortgage rates and millennials reaching peak homebuying years led to an influx of buyer demand. At the same time, there weren’t enough homes available to purchase thanks to many years of underbuilding and sellers who held off on listing their homes due to the health crisis.

This combination led to record-high demand and record-low supply, and that wasn’t going to be sustainable for the long term. The latest data shows early signs of a shift back to the market pace seen in the years leading up to the pandemic – not a crash nor a correction. As realtor.com says:

The housing market is at a turning point. . . . We’re starting to see signs of a new direction, . . .”

Home Showings Then and Now

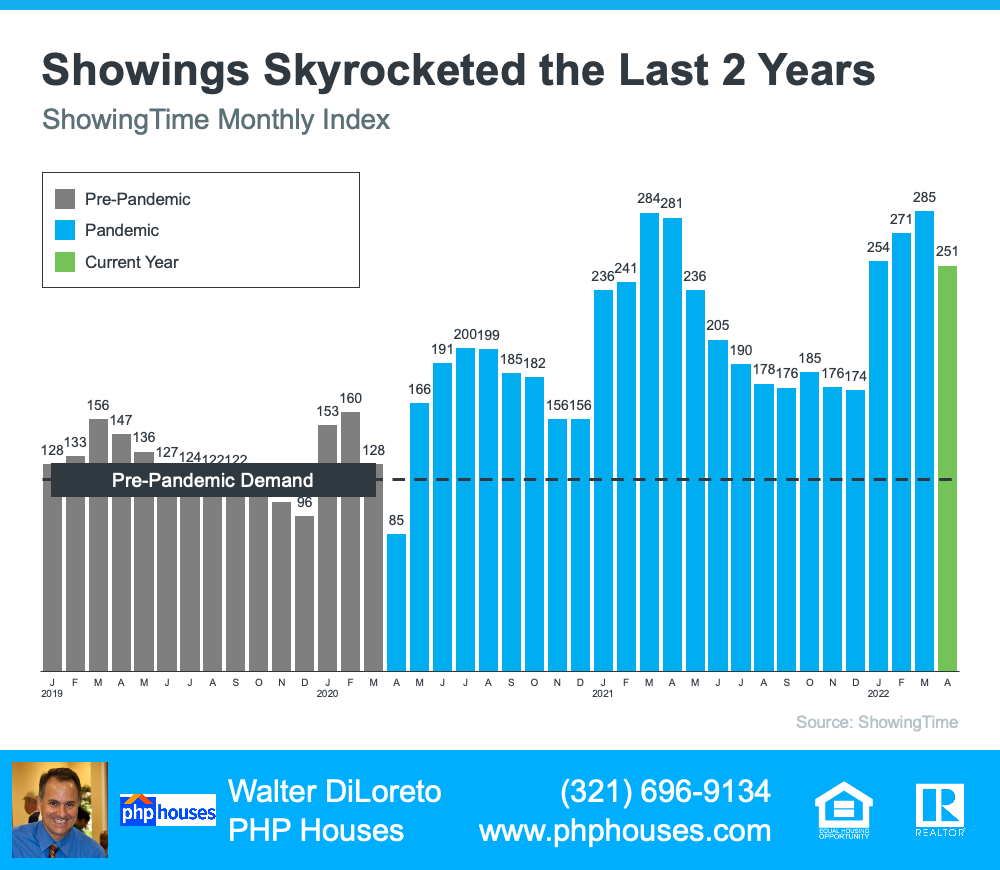
The ShowingTime Showing Index tracks the traffic of home showings according to agents and brokers. It’s a good indication of buyer demand. Here’s a look at that data going back to 2019 (see graph below):

Graph
Showings Skyrocketed the Last 2 Years

The 2019 numbers give a good baseline of pre-pandemic demand (shown in gray). As the graph indicates, home showings skyrocketed during the pandemic (shown in blue). And while current buyer demand has begun to moderate slightly based on the latest data (shown in green), showings are still above 2019 levels.

And since 2019 was such a strong year for the housing market, this helps show that the market isn’t crashing – it’s just at a turning point that’s moving back toward more pre-pandemic levels.

Existing Home Sales Then and Now

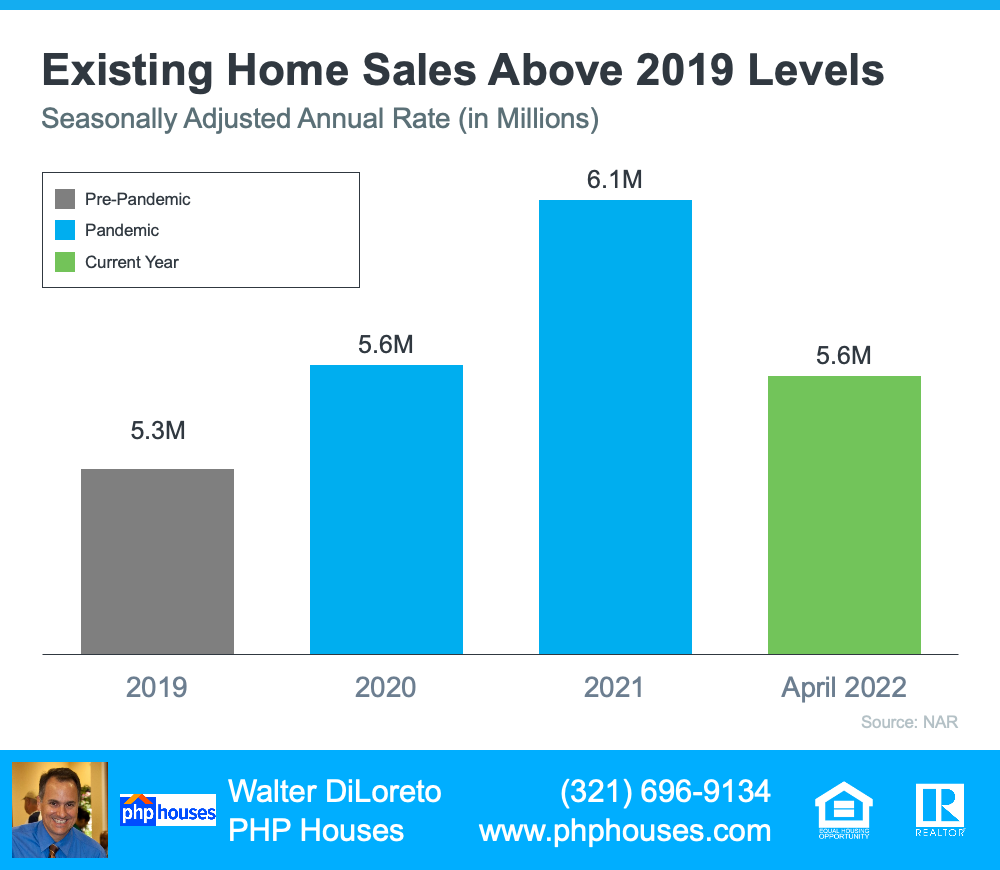
Headlines are also talking about how existing home sales are declining, but perspective matters. Here’s a look at existing home sales going all the way back to 2019 using data from the National Association of Realtors (NAR) (see graph below):

Graphs
Existing Home Sales Above 2019 Level

Again, a similar story emerges. The pandemic numbers (shown in blue) beat the more typical year of 2019 home sales (shown in gray). And according to the latest projections for 2022 (shown in green), the market is on pace to close this year with more home sales than 2019 as well.

It’s important to compare today not to the abnormal pandemic years, but to the most recent normal year to show the current housing market is still strong. First American sums it up like this:

“. . . today’s housing market looks a lot like the 2019 housing market, which was the strongest housing market in a decade at the time.”

Bottom Line

If recent headlines are generating any concerns, look at a more typical year for perspective. The current market is not a crash or correction. It’s just a turning point toward more typical, pre-pandemic levels. Let’s connect if you have any questions about our local market and what it means for you when you buy or sell this year.

Contact us:
PHP Houses
142 W Lakeview Ave
Unit 1030
Lake Mary, FL 32746
Ph: (407) 519-0719
Fax: (407) 205-1951
email: info@phphouses.com

Let’s Connect:
Facebook
Linkedin
Twitter
Instagram

The information contained, and the opinions expressed, in this article are not intended to be construed as investment advice. The author does not guarantee or warrant the accuracy or completeness of the information or opinions contained herein. Nothing herein should be construed as investment advice. You should always conduct your own research and due diligence and obtain professional advice before making any investment decision. The author will not be liable for any loss or damage caused by your reliance on the information or opinions contained herein.
 

Categories
Real Estate Market

History Proves Recession Doesn’t Equal a Housing Crisis [INFOGRAPHIC]

Infographic
History Proves Recession Doesn’t Equal a Housing Crisis [INFOGRAPHIC]

Some Highlights

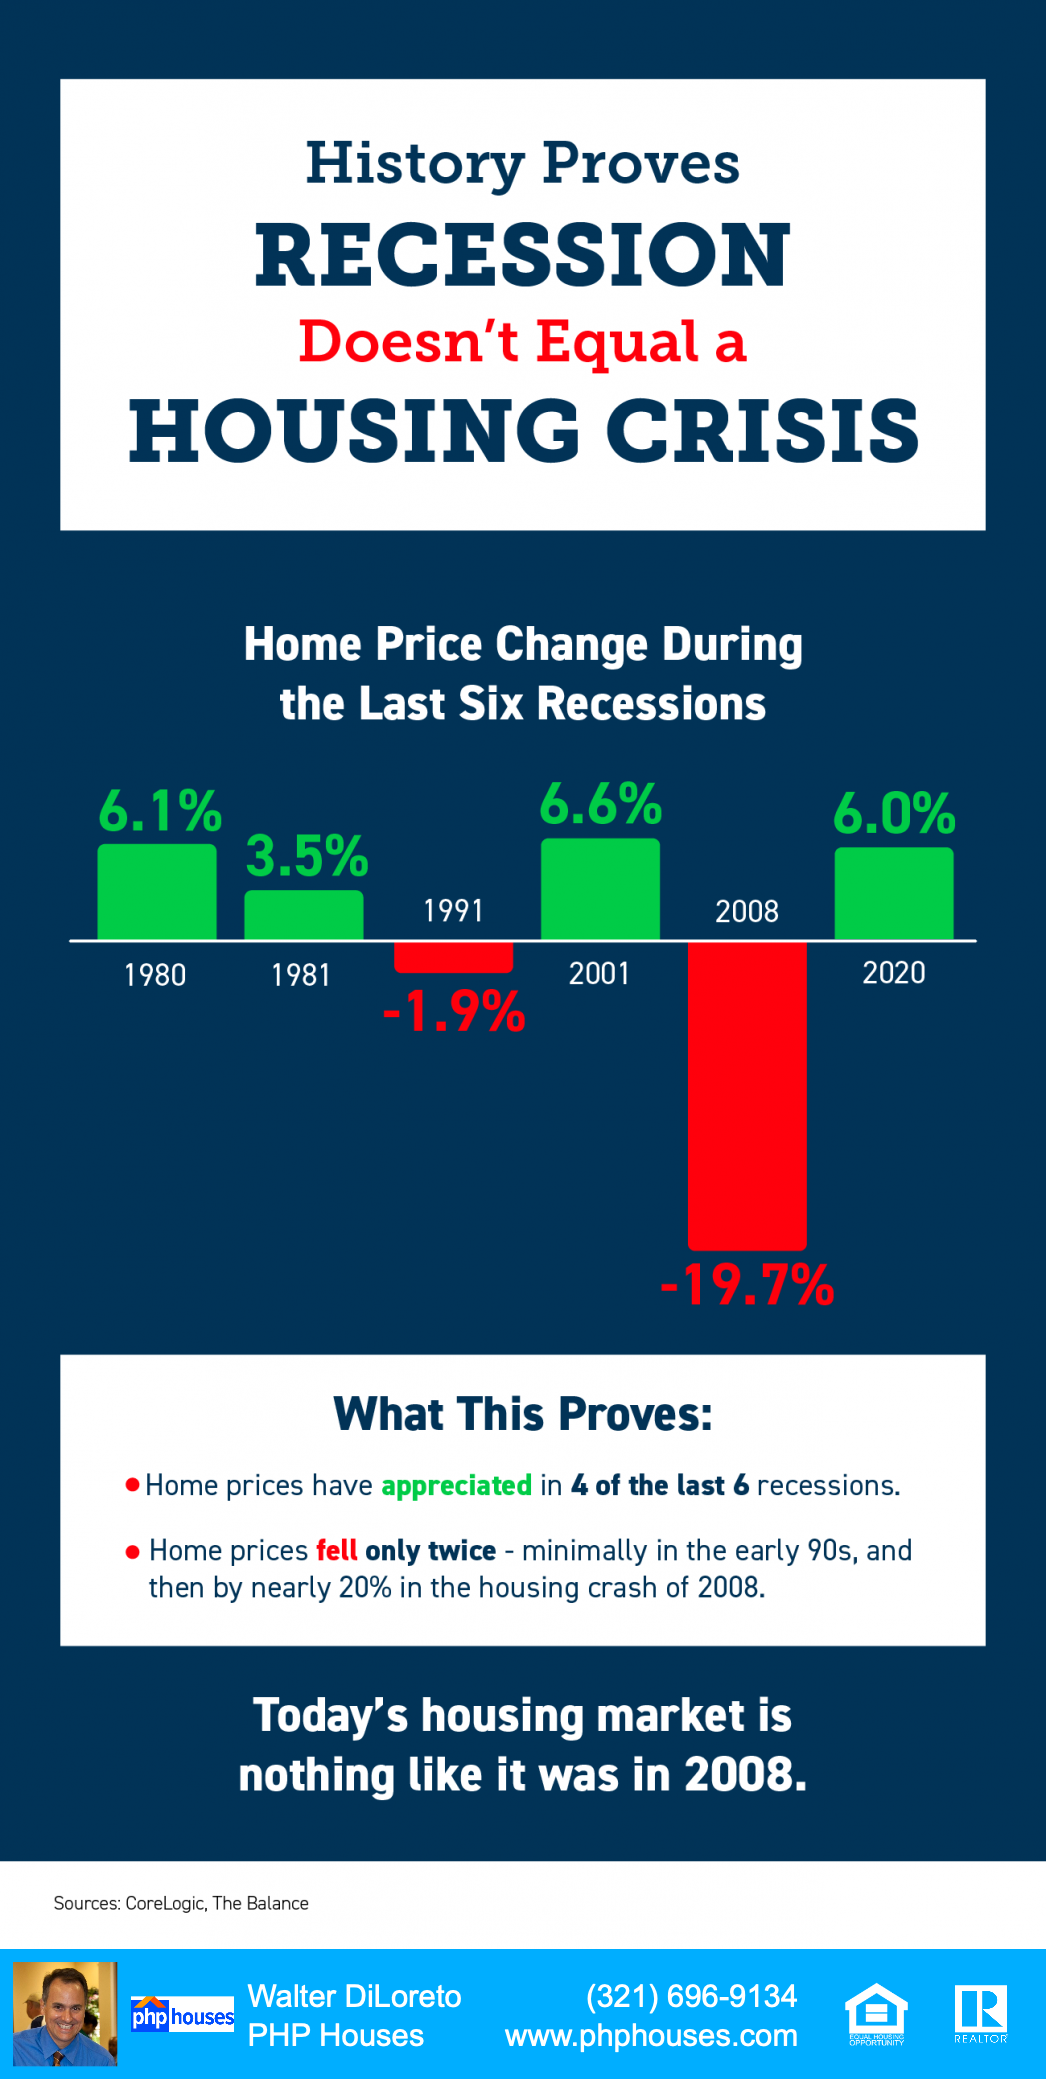
  • It’s important to understand history proves an economic slowdown does not equal a housing crisis.
  • In 4 of the last 6 recessions, home prices actually appreciated. Home prices only fell twice – minimally in the early 90s and then by nearly 20% during the housing crash in 2008.
  • If you have questions, let’s connect to discuss why today’s housing market is nothing like 2008.


Contact us:
PHP Houses
142 W Lakeview Ave
Unit 1030
Lake Mary, FL 32746
Ph: (407) 519-0719
Fax: (407) 205-1951
email: info@phphouses.com

Let’s Connect:
Facebook
Linkedin
Twitter
Instagram

The information contained, and the opinions expressed, in this article are not intended to be construed as investment advice. The author does not guarantee or warrant the accuracy or completeness of the information or opinions contained herein. Nothing herein should be construed as investment advice. You should always conduct your own research and due diligence and obtain professional advice before making any investment decision. The author will not be liable for any loss or damage caused by your reliance on the information or opinions contained herein.


Categories
Real Estate Market

The One Thing Every Homeowner Needs To Know About a Recession

The One Thing Every Homeowner Needs To Know About a Recession

A recession does not equal a housing crisis. That’s the one thing that every homeowner today needs to know. Everywhere you look, experts are warning we could be heading toward a recession, and if true, an economic slowdown doesn’t mean homes will lose value.

The National Bureau of Economic Research (NBER) defines a recession this way:

“A recession is a significant decline in economic activity spread across the economy, normally visible in production, employment, and other indicators. A recession begins when the economy reaches a peak of economic activity and ends when the economy reaches its trough. Between trough and peak, the economy is in an expansion.”

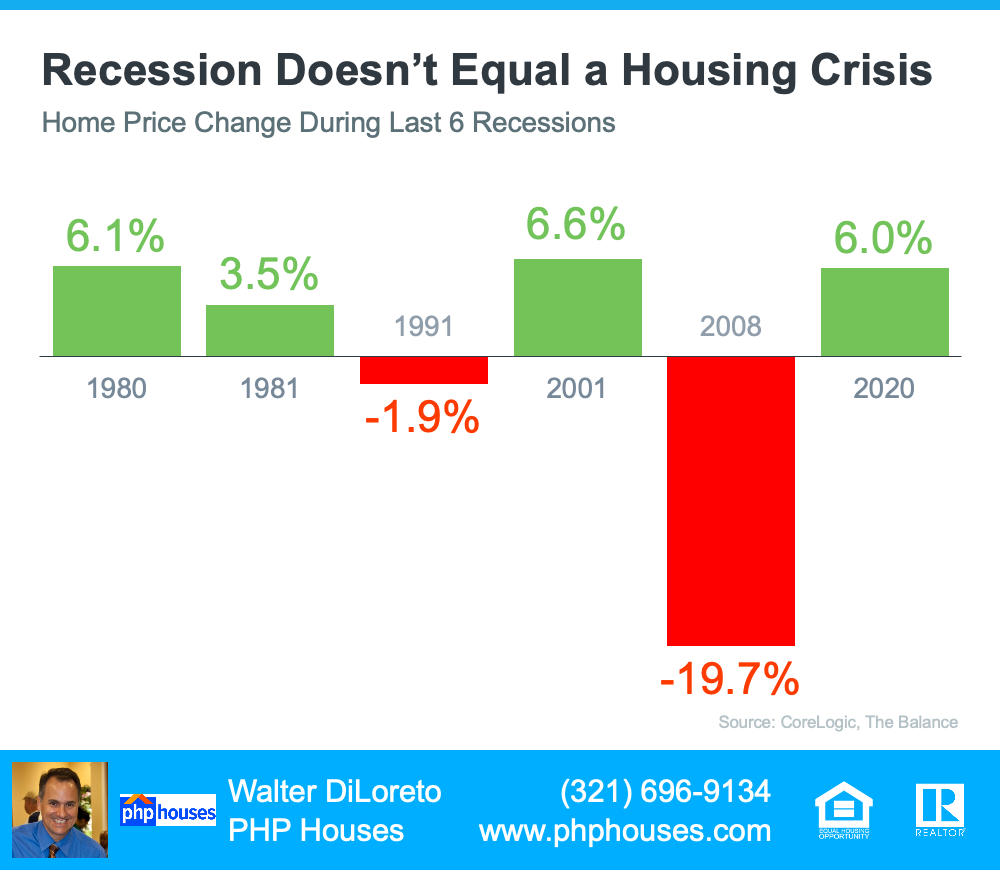
To help show that home prices don’t fall every time there’s a recession, take a look at the historical data. There have been six recessions in this country over the past four decades. As the graph below shows, looking at the recessions going all the way back to the 1980s, home prices appreciated four times and depreciated only two times. So, historically, there’s proof that when the economy slows down, it doesn’t mean home values will fall or depreciate.

Graph
Recession Doesn’t Equal a Housing Crisis

The first occasion on the graph when home values depreciated was in the early 1990s when home prices dropped by less than 2%. It happened again during the housing crisis in 2008 when home values declined by almost 20%. Most people vividly remember the housing crisis in 2008 and think if we were to fall into a recession that we’d repeat what happened then. But this housing market isn’t a bubble that’s about to burst. The fundamentals are very different today than they were in 2008. So, we shouldn’t assume we’re heading down the same path.

Bottom Line

We’re not in a recession in this country, but if one is coming, it doesn’t mean homes will lose value. History proves a recession doesn’t equal a housing crisis.

Contact us:
PHP Houses
142 W Lakeview Ave
Unit 1030
Lake Mary, FL 32746
Ph: (407) 519-0719
Fax: (407) 205-1951
email: info@phphouses.com

Let’s Connect:
Facebook
Linkedin
Twitter
Instagram

The information contained, and the opinions expressed, in this article are not intended to be construed as investment advice. The author does not guarantee or warrant the accuracy or completeness of the information or opinions contained herein. Nothing herein should be construed as investment advice. You should always conduct your own research and due diligence and obtain professional advice before making any investment decision. The author will not be liable for any loss or damage caused by your reliance on the information or opinions contained herein.

 

Categories
Real Estate Market

Why This Housing Market Is Not a Bubble Ready To Pop

Why This Housing Market Is Not a Bubble Ready To Pop

Homeownership has become a major element in achieving the American Dream. A recent report from the National Association of Realtors (NAR) finds that over 86% of buyers agree homeownership is still the American Dream.

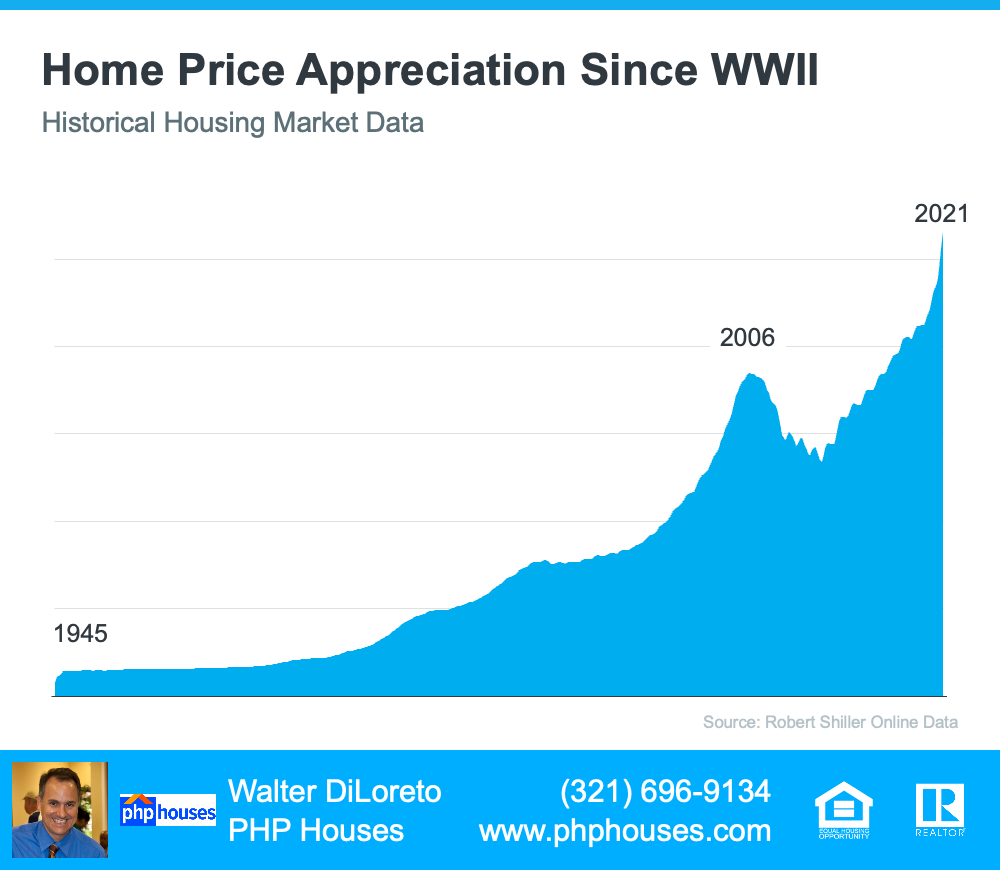
Prior to the 1950s, less than half of the country owned their own home. However, after World War II, many returning veterans used the benefits afforded by the GI Bill to purchase a home. Since then, the percentage of homeowners throughout the country has increased to the current rate of 65.5%. That strong desire for homeownership has kept home values appreciating ever since. The graph below tracks home price appreciation since the end of World War II:

Graph
Home Price Appreciation Since WWII

The graph shows the only time home values dropped significantly was during the housing boom and bust of 2006-2008. If you look at how prices spiked prior to 2006, it looks a bit like the current spike in prices over the past two years. That may lead some people to be concerned we’re about to see a similar fall in home values as we did when the bubble burst. To help alleviate those worries, let’s look at what happened last time and what’s happening today.

What Caused the Housing Crash 15 Years Ago?

Back in 2006, foreclosures flooded the market. That drove down home values dramatically. The two main reasons for the flood of foreclosures were:

1. Many purchasers were not truly qualified for the mortgage they obtained, which led to more homes turning into foreclosures.
2. A number of homeowners cashed in the equity on their homes. When prices dropped, they found themselves in an underwater situation (where the home was worth less than the mortgage on the house). Many of these homeowners walked away from their homes, leading to more foreclosures. This lowered neighboring home values even more.

This cycle continued for years.

Why Today’s Real Estate Market Is Different

Here are two reasons today’s market is nothing like the one we experienced 15 years ago.

1. Today, Demand for Homeownership Is Real (Not Artificially Generated)

Running up to 2006, banks were creating artificial demand by lowering lending standards and making it easy for just about anyone to qualify for a home loan or refinance their current home. Today, purchasers and those refinancing a home face much higher standards from mortgage companies.

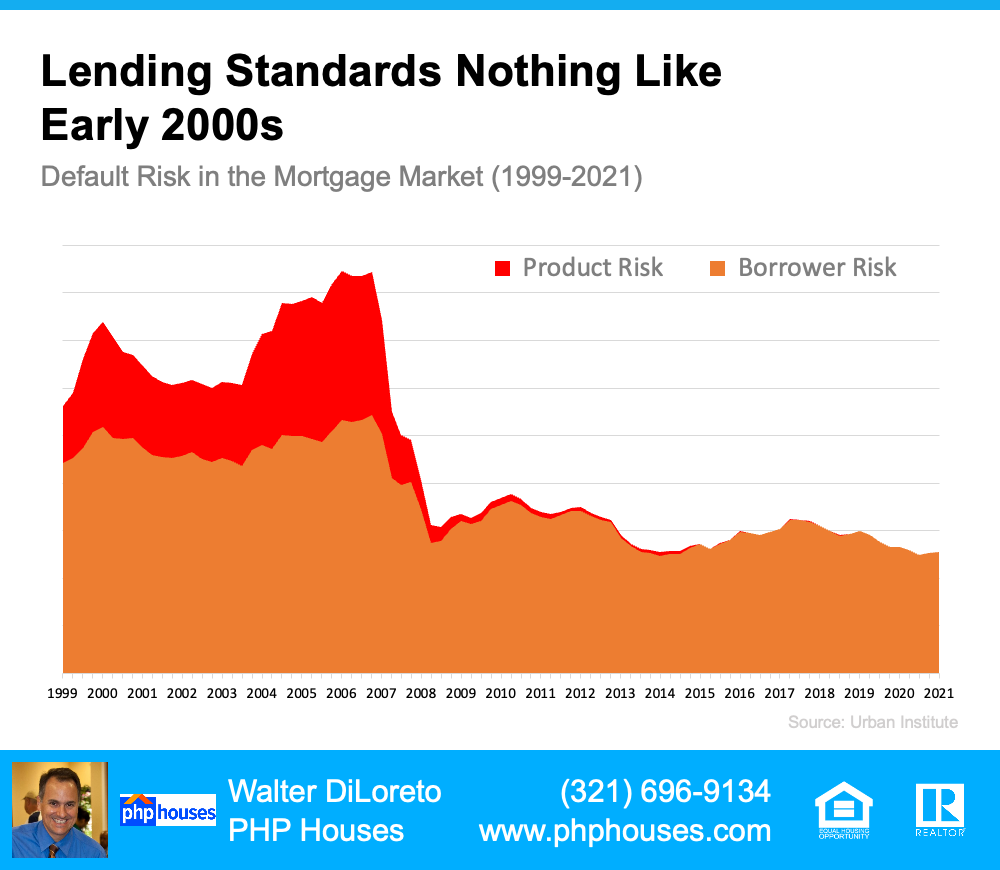
Data from the Urban Institute shows the amount of risk banks were willing to take on then as compared to now.

Graph
Lending Standards Nothing Like Early 2000s

There’s always risk when a bank loans money. However, leading up to the housing crash 15 years ago, lending institutions took on much greater risks in both the person and the mortgage product offered. That led to mass defaults, foreclosures, and falling prices.

Today, the demand for homeownership is real. It’s generated by a re-evaluation of the importance of home due to a worldwide pandemic. Additionally, lending standards are much stricter in the current lending environment. Purchasers can afford the mortgage they’re taking on, so there’s little concern about possible defaults.

And if you’re worried about the number of people still in forbearance, you should know there’s no risk of that causing an upheaval in the housing market today. There won’t be a flood of foreclosures.

2. People Are Not Using Their Homes as ATMs Like They Did in the Early 2000s

As mentioned above, when prices were rapidly escalating in the early 2000s, many thought it would never end. They started to borrow against the equity in their homes to finance new cars, boats, and vacations. When prices started to fall, many of these homeowners were underwater, leading some to abandon their homes. This increased the number of foreclosures.

Homeowners didn’t forget the lessons of the crash as prices skyrocketed over the last few years. Black Knight reports that tappable equity (the amount of equity available for homeowners to access before hitting a maximum 80% loan-to-value ratio, or LTV) has more than doubled compared to 2006 ($4.6 trillion to $9.9 trillion).

The latest Homeowner Equity Insights report from CoreLogic reveals that the average homeowner gained $55,300 in home equity over the past year alone. Odeta Kushi, Deputy Chief Economist at First American, reports:

“Homeowners in Q4 2021 had an average of $307,000 in equity – a historic high.”

ATTOM Data Services also reveals that 41.9% of all mortgaged homes have at least 50% equity. These homeowners will not face an underwater situation even if prices dip slightly. Today, homeowners are much more cautious.

Bottom Line

The major reason for the housing crash 15 years ago was a tsunami of foreclosures. With much stricter mortgage standards and a historic level of homeowner equity, the fear of massive foreclosures impacting today’s market is not realistic.

Contact us:
PHP Houses
142 W Lakeview Ave
Unit 1030
Lake Mary, FL 32746
Ph: (407) 519-0719
Fax: (407) 205-1951
email: info@phphouses.com

Let’s Connect:
Facebook
Linkedin
Twitter
Instagram

The information contained, and the opinions expressed, in this article are not intended to be construed as investment advice. The author does not guarantee or warrant the accuracy or completeness of the information or opinions contained herein. Nothing herein should be construed as investment advice. You should always conduct your own research and due diligence and obtain professional advice before making any investment decision. The author will not be liable for any loss or damage caused by your reliance on the information or opinions contained herein.
 

Categories
Real Estate Market

4 Simple Graphs Showing Why This Is Not a Housing Bubble

4 Simple Graphs Showing Why This Is Not a Housing Bubble

A recent survey revealed that many consumers believe there’s a housing bubble beginning to form. That feeling is understandable, as year-over-year home price appreciation is still in the double digits. However, this market is very different than it was during the housing crash 15 years ago. Here are four key reasons why today is nothing like the last time.

1. Houses Are Not Unaffordable Like They Were During the Housing Boom

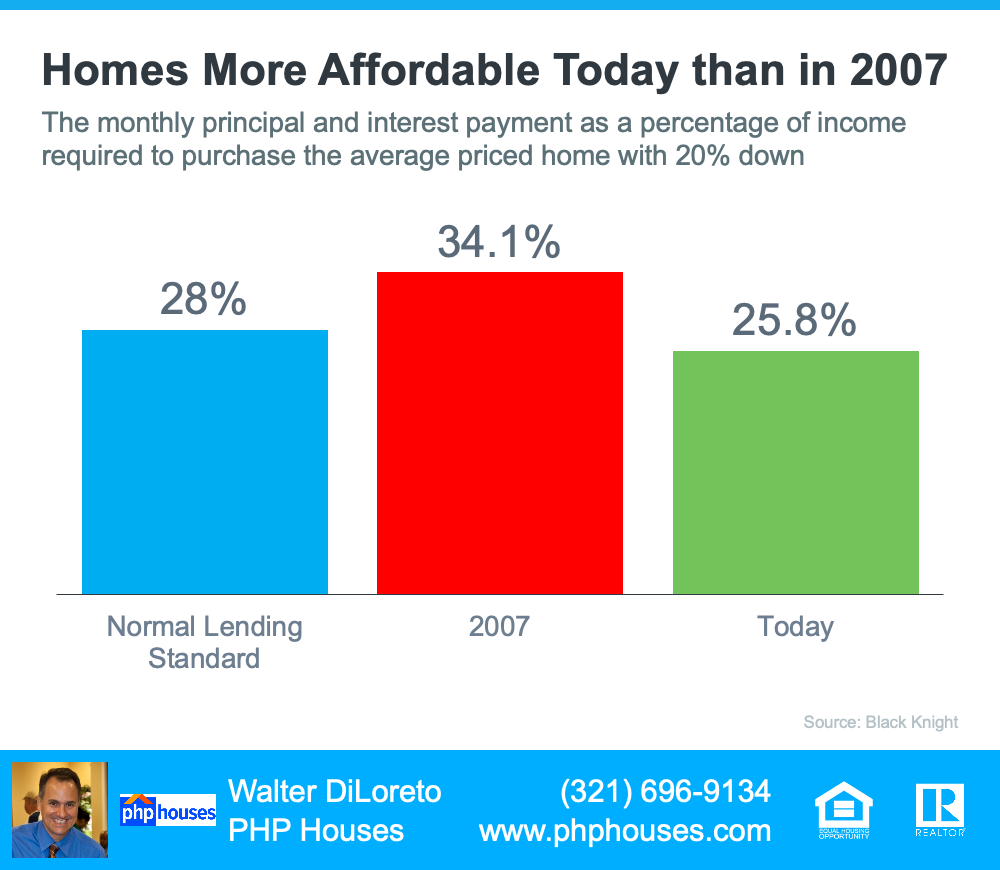
The affordability formula has three components: the price of the home, wages earned by the purchaser, and the mortgage rate available at the time. Conventional lending standards say a purchaser should not spend more than 28%of their gross income on their mortgage payment.

Fifteen years ago, prices were high, wages were low, and mortgage rates were over 6%. Today, prices are still high. Wages, however, have increased, and the mortgage rate, even after the recent spike, is still well below 6%. That means the average purchaser today pays less of their monthly income toward their mortgage payment than they did back then.

In the latest Affordability Report by ATTOM Data, Chief Product Officer Todd Teta addresses that exact point:

“The average wage earner can still afford the typical home across the U.S., but the financial comfort zone continues shrinking as home prices keep soaring and mortgage rates tick upward.”

Affordability isn’t as strong as it was last year, but it’s much better than it was during the boom. Here’s a chart showing that difference:

Graph
Homes More Affordable Today than in 2007

If costs were so prohibitive, how did so many homes sell during the housing boom?

2. Mortgage Standards Were Much More Relaxed During the Boom

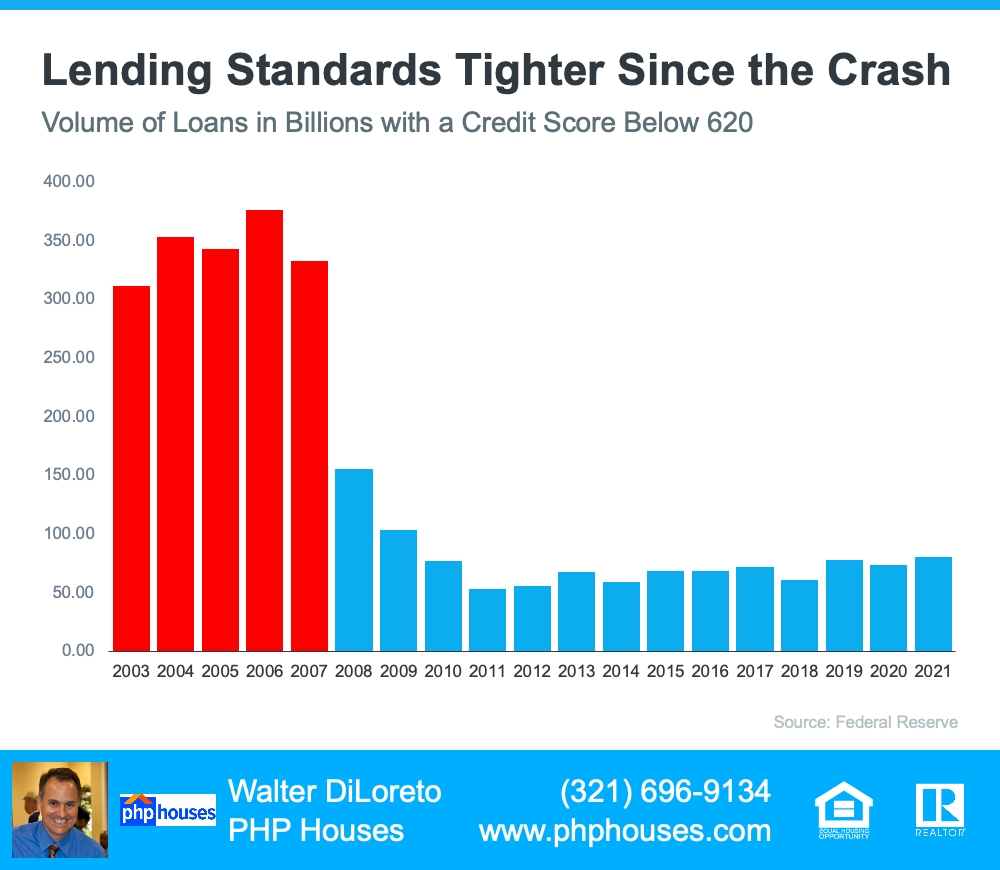
During the housing bubble, it was much easier to get a mortgage than it is today. As an example, let’s review the number of mortgages granted to purchasers with credit scores under 620. According to credit.org, a credit score between 550-619 is considered poor. In defining those with a score below 620, they explain:

“Credit agencies consider consumers with credit delinquencies, account rejections, and little credit history as subprime borrowers due to their high credit risk.”

Buyers can still qualify for a mortgage with a credit score that low, but they’re considered riskier borrowers. Here’s a graph showing the mortgage volume issued to purchasers with a credit score less than 620 during the housing boom, and the subsequent volume in the 14 years since.

Graph
Lending Standards Tighter Since the Crash

Mortgage standards are nothing like they were the last time. Purchasers that acquired a mortgage over the last decade are much more qualified. Let’s take a look at what that means going forward.

3. The Foreclosure Situation Is Nothing Like It Was During the Crash

The most obvious difference is the number of homeowners that were facing foreclosure after the housing bubble burst. The Federal Reserve issues a report showing the number of consumers with a new foreclosure notice. Here are the numbers during the crash compared to today:

Graph
Foreclosure Situation Is Different Now

There’s no doubt the 2020 and 2021 numbers are impacted by the forbearance program, which was created to help homeowners facing uncertainty during the pandemic. However, there are fewer than 800,000 homeowners left in the program today, and most of those will be able to work out a repayment plan with their banks.

Rick Sharga, Executive Vice President of RealtyTrac, explains:

“The fact that foreclosure starts declined despite hundreds of thousands of borrowers exiting the CARES Act mortgage forbearance program over the last few months is very encouraging. It suggests that the ‘forbearance equals foreclosure’ narrative was incorrect.”

Why are there so few foreclosures now? Today, homeowners are equity rich, not tapped out.

In the run-up to the housing bubble, some homeowners were using their homes as personal ATM machines. Many immediately withdrew their equity once it built up. When home values began to fall, some homeowners found themselves in a negative equity situation where the amount they owed on their mortgage was greater than the value of their home. Some of those households decided to walk away from their homes, and that led to a rash of distressed property listings (foreclosures and short sales), which sold at huge discounts, thus lowering the value of other homes in the area.

Homeowners, however, have learned their lessons. Prices have risen nicely over the last few years, leading to over 40%of homes in the country having more than 50% equity. But owners have not been tapping into it like the last time, as evidenced by the fact that national tappable equity has increased to a record $9.9 trillion. With the average home equity now standing at $300,000, what happened last time won’t happen today.

As the latest Homeowner Equity Insights report from CoreLogic explains:

“Not only have equity gains helped homeowners more seamlessly transition out of forbearance and avoid a distressed sale, but they’ve also enabled many to continue building their wealth.”

There will be nowhere near the same number of foreclosures as we saw during the crash. So, what does that mean for the housing market?

4. We Don’t Have a Surplus of Homes on the Market – We Have a Shortage

The supply of inventory needed to sustain a normal real estate market is approximately six months. Anything more than that is an overabundance and will causes prices to depreciate. Anything less than that is a shortage and will lead to continued price appreciation. As the next graph shows, there were too many homes for sale from 2007 to 2010 (many of which were short sales and foreclosures), and that caused prices to tumble. Today, there’s a shortage of inventory, which is causing the acceleration in home values to continue.

Graph
Supply of Homes Is Nothing Like Last Time

Inventory is nothing like the last time. Prices are rising because there’s a healthy demand for homeownership at the same time there’s a shortage of homes for sale.

Bottom Line

If you’re worried that we’re making the same mistakes that led to the housing crash, the graphs above show data and insights to help alleviate your concerns.

Contact us:
PHP Houses
142 W Lakeview Ave
Unit 1030
Lake Mary, FL 32746
Ph: (407) 519-0719
Fax: (407) 205-1951
email: info@phphouses.com

Let’s Connect:
Facebook
Linkedin
Twitter
Instagram

The information contained, and the opinions expressed, in this article are not intended to be construed as investment advice. The author does not guarantee or warrant the accuracy or completeness of the information or opinions contained herein. Nothing herein should be construed as investment advice. You should always conduct your own research and due diligence and obtain professional advice before making any investment decision. The author will not be liable for any loss or damage caused by your reliance on the information or opinions contained herein.

 

Categories
Real Estate Market

3 Charts That Show This Isn’t a Housing Bubble

3 Charts That Show This Isn’t a Housing Bubble

With home prices continuing to deliver double-digit increases, some are concerned we’re in a housing bubble like the one in 2006. However, a closer look at the market data indicates this is nothing like 2006 for three major reasons.

1. The housing market isn’t driven by risky mortgage loans.

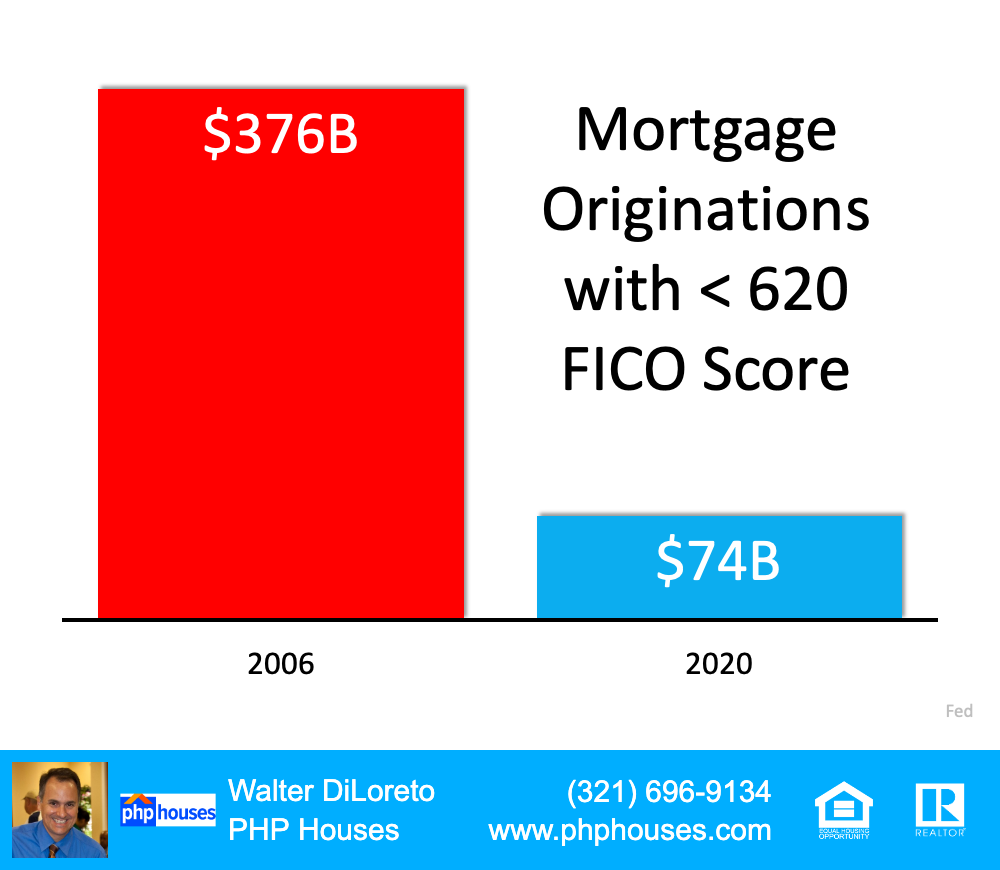
Back in 2006, nearly everyone could qualify for a loan. The Mortgage Credit Availability Index (MCAI) from the Mortgage Bankers’ Association is an indicator of the availability of mortgage money. The higher the index, the easier it is to obtain a mortgage. The MCAI more than doubled from 2004 (378) to 2006 (869). Today, the index stands at 130. As an example of the difference between today and 2006, let’s look at the volume of mortgages that originated when a buyer had less than a 620 credit score.

Mortgage Originations with < 620 FICO Score

Dr. Frank Nothaft, Chief Economist for CoreLogic, reiterates this point:

“There are marked differences in today’s run up in prices compared to 2005, which was a bubble fueled by risky loans and lenient underwriting. Today, loans with high-risk features are absent and mortgage underwriting is prudent.”

2. Homeowners aren’t using their homes as ATMs this time.

During the housing bubble, as prices skyrocketed, people were refinancing their homes and pulling out large sums of cash. As prices began to fall, that caused many to spiral into a negative equity situation (where their mortgage was higher than the value of the house).

Today, homeowners are letting their equity build. Tappable equity is the amount available for homeowners to access before hitting a maximum 80% combined loan-to-value ratio (thus still leaving them with at least 20% equity). In 2006, that number was $4.6 billion. Today, that number stands at over $8 billion.

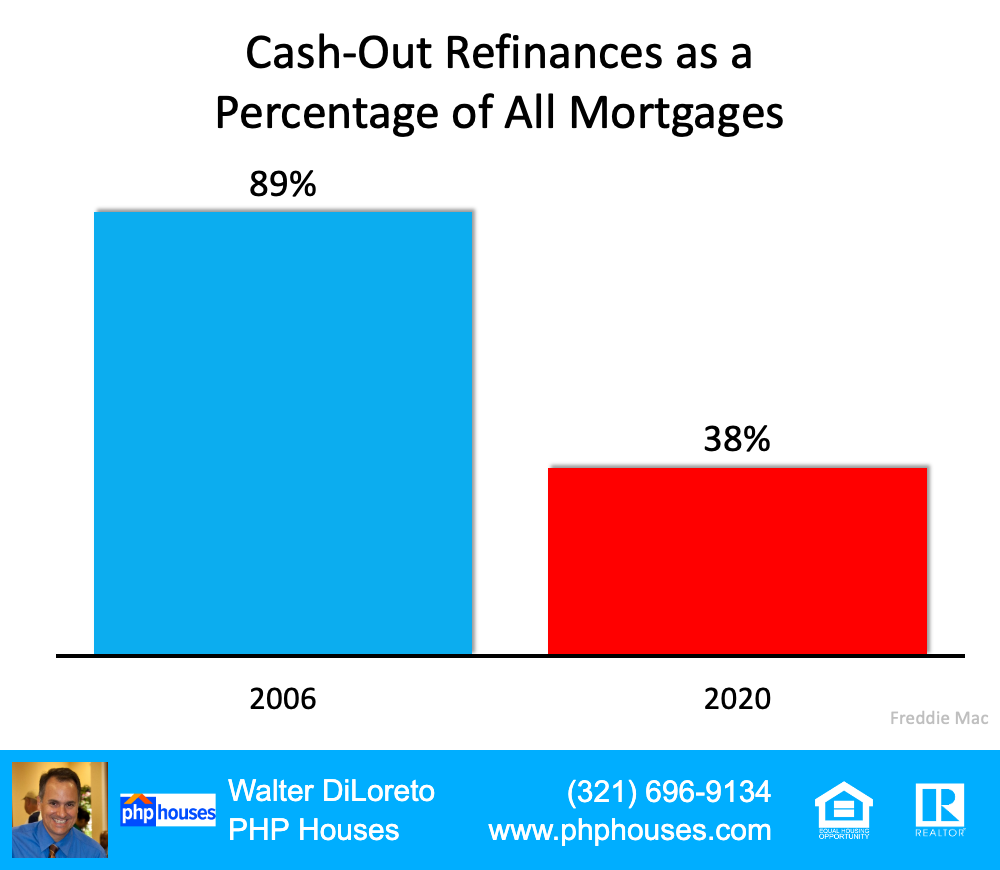
Yet, the percentage of cash-out refinances (where the homeowner takes out at least 5% more than their original mortgage amount) is half of what it was in 2006.

Cash-Out Refinances as a Percentage of All Mortgages

3. This time, it’s simply a matter of supply and demand.

FOMO (the Fear Of Missing Out) dominated the housing market leading up to the 2006 housing bubble and drove up buyer demand. Back then, housing supply more than kept up as many homeowners put their houses on the market, as evidenced by the over seven months’ supply of existing housing inventory available for sale in 2006. Today, that number is barely two months.

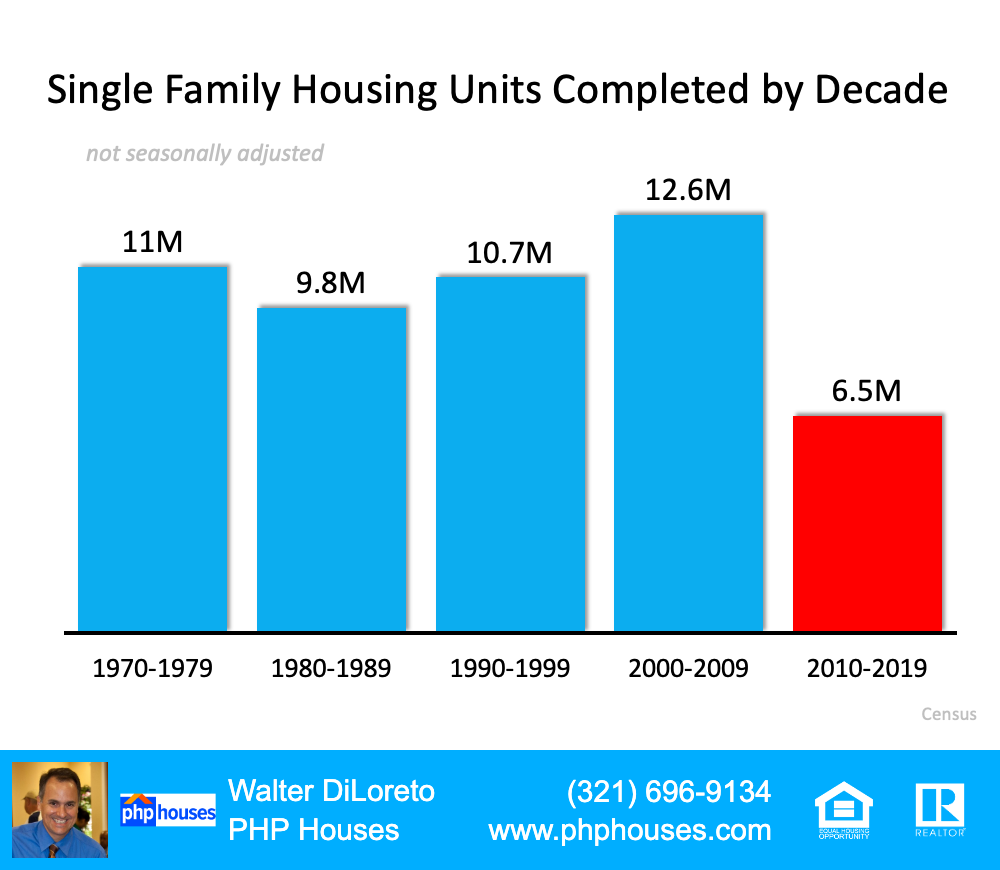
Builders also overbuilt during the bubble but pulled back significantly over the next decade. Sam Khater, VP and Chief Economist, Economic & Housing Research at Freddie Macexplains that pullback is the major factor in the lack of available inventory today:

“The main driver of the housing shortfall has been the long-term decline in the construction of single-family homes.”

Here’s a chart that quantifies Khater’s remarks:

Single Family Housing Units Completed by Decade

Today, there are simply not enough homes to keep up with current demand.

Bottom Line

This market is nothing like the run-up to 2006. Bill McBride, the author of the prestigious Calculated Risk blog, predicted the last housing bubble and crash. This is what he has to say about today’s housing market:

“It’s not clear at all to me that things are going to slow down significantly in the near future. In 2005, I had a strong sense that the hot market would turn and that, when it turned, things would get very ugly. Today, I don’t have that sense at all, because all of the fundamentals are there. Demand will be high for a while because Millennials need houses. Prices will keep rising for a while because inventory is so low.”

Contact us:
PHP Houses
142 W Lakeview Ave
Unit 1030
Lake Mary, FL 32746
Ph: (407) 519-0719
Fax: (407) 205-1951
email: info@phphouses.com

Let’s Connect:
Facebook
Linkedin
Twitter
Instagram

THE INFORMATION PRESENTED IN THIS ARTICLE IS FOR EDUCATIONAL PURPOSES ONLY AND SHOULD NOT BE CONSIDERED LEGAL, FINANCIAL, OR AS ANY OTHER TYPE OF ADVICE.
Categories
Real Estate Market

Are We in a Housing Bubble? Experts Say No.

Are We in a Housing Bubble? Experts Say No.

The question of whether the real estate market is a bubble ready to pop seems to be dominating a lot of conversations – and everyone has an opinion. Yet, when it comes down to it, the opinions that carry the most weight are the ones based on experience and expertise.

Here are four expert opinions from professionals and organizations that have devoted their careers to giving great advice to the housing industry.

The Joint Center for Housing Studies in their The State of the Nation’s Housing 2021 report:

“… conditions today are quite different than in the early 2000s, particularly in terms of credit availability. The current climb in house prices instead reflects strong demand amid tight supply, helped along by record-low interest rates.”

Nathaniel Karp, Chief U.S. Economist at BBVA:

“The housing market is in line with fundamentals as interest rates are attractive and incomes are high due to fiscal stimulus, making debt servicing relatively affordable and allowing buyers to qualify for larger mortgages. Underwriting standards are still strong, so there is little risk of a bubble developing.”

Bill McBride of Calculated Risk:

“It’s not clear at all to me that things are going to slow down significantly in the near future. In 2005, I had a strong sense that the hot market would turn and that, when it turned, things would get very ugly. Today, I don’t have that sense at all, because all of the fundamentals are there. Demand will be high for a while, because Millennials need houses. Prices will keep rising for a while, because inventory is so low.”

Mark Fleming, Chief Economist at First American:

Looking back at the bubble years, house prices exceeded house-buying power in 2006 nationally, but today house-buying power is nearly twice as high as the median sale price nationally…

Many find it hard to believe, but housing is actually undervalued in most markets and the gap between house-buying power and sale prices indicates there’s room for further house price growth in the months to come.”

Bottom Line

All four strongly believe that we’re not in a bubble and won’t see crashing home values as we did in 2008. And they’re not alone – Goldman Sachs, JP Morgan, Morgan Stanley, and Merrill Lynch share the same opinion.

Contact us:
PHP Houses
142 W Lakeview Ave
Unit 1030
Lake Mary, FL 32746
Ph: (407) 519-0719
Fax: (407) 205-1951
email: info@phphouses.com

Let’s Connect:
Facebook
Linkedin
Twitter
Instagram

THE INFORMATION PRESENTED IN THIS ARTICLE IS FOR EDUCATIONAL PURPOSES ONLY AND SHOULD NOT BE CONSIDERED LEGAL, FINANCIAL, OR AS ANY OTHER TYPE
Categories
Real Estate Market

This Isn’t a Bubble. It’s Simply Lack of Supply. [INFOGRAPHIC]

Infographic
This Isn’t a Bubble. It’s Simply Lack of Supply. [INFOGRAPHIC]

Some Highlights

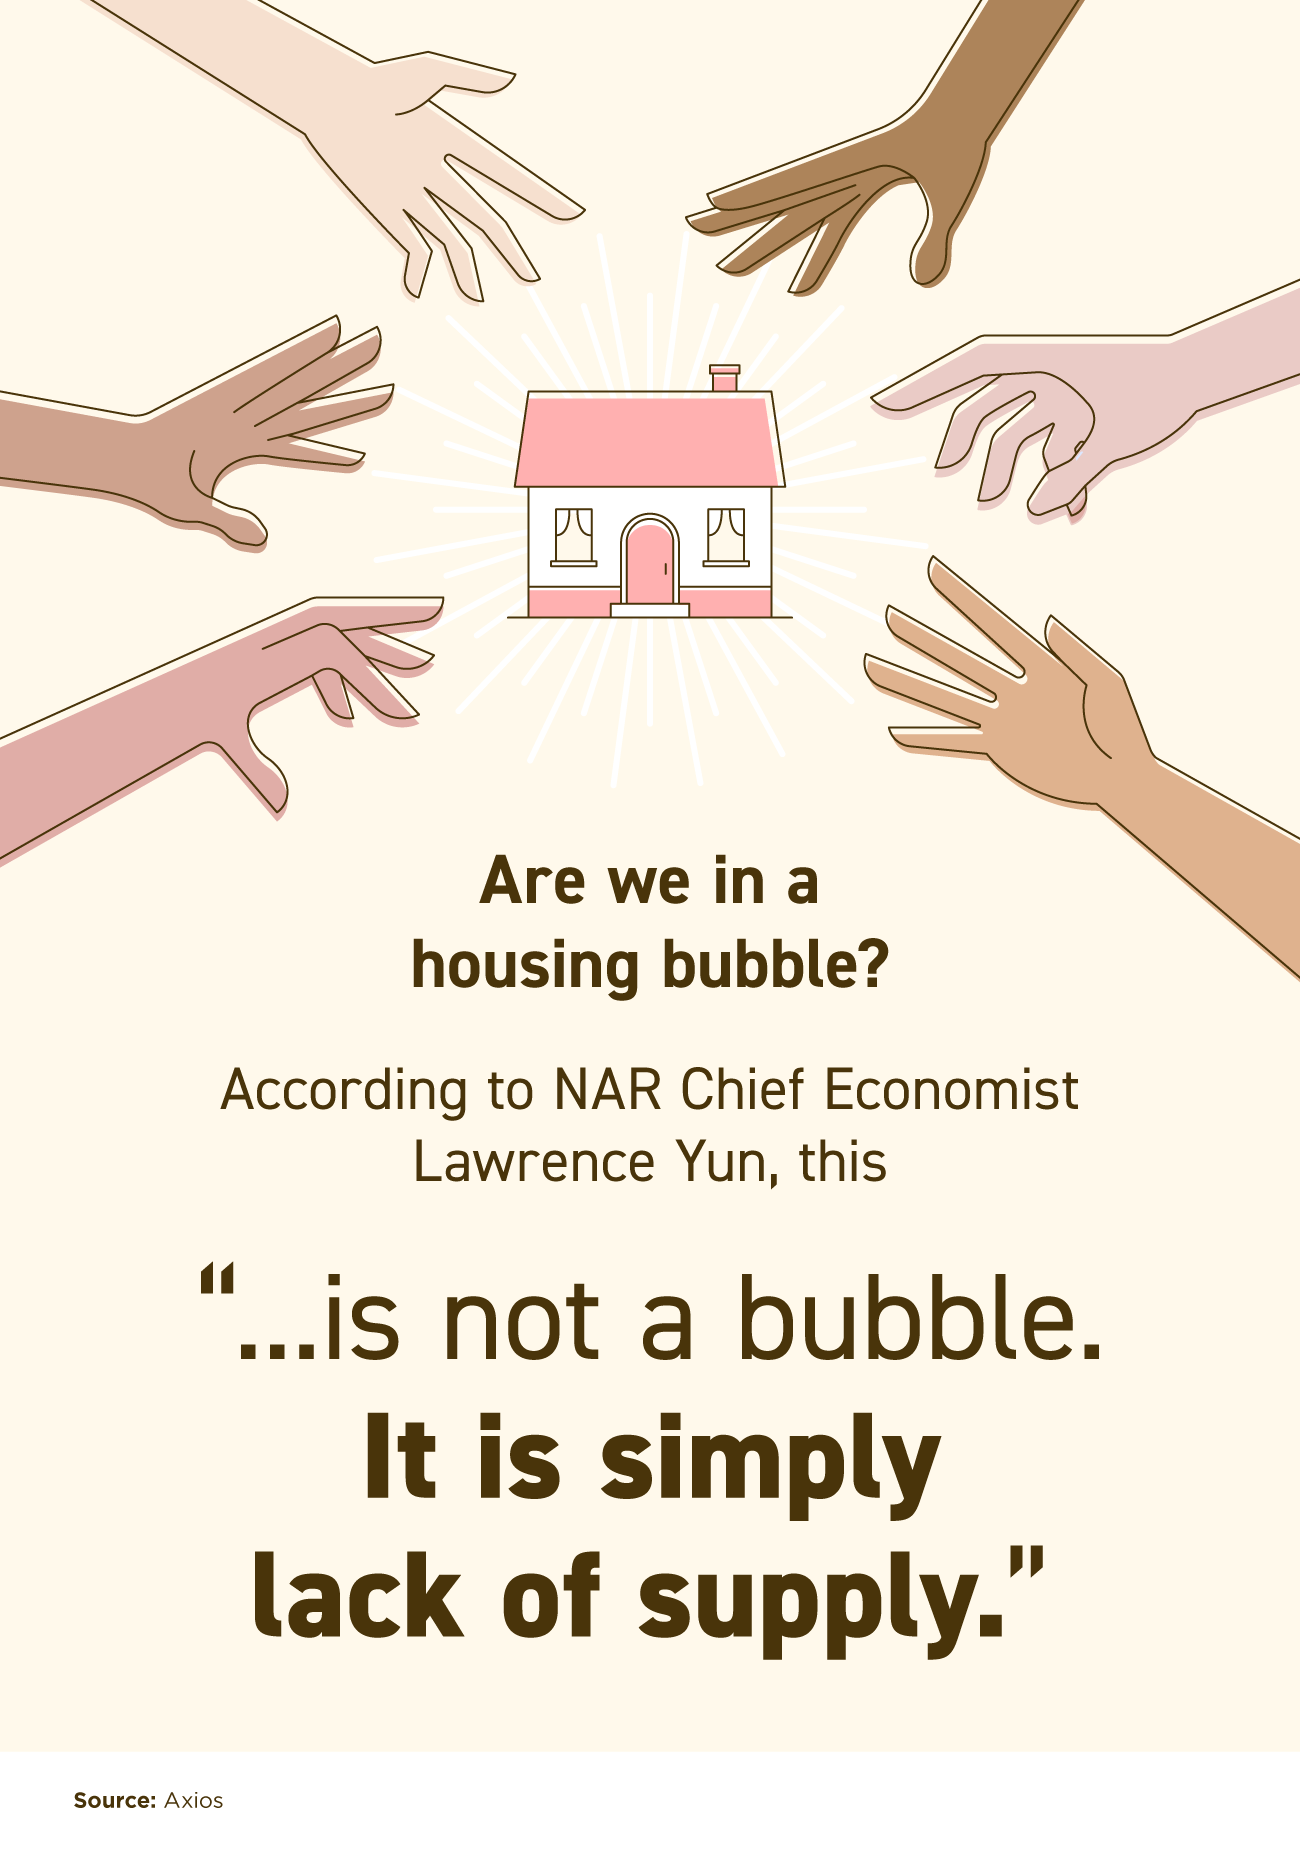
  • In a recent article, Lawrence Yun, Chief Economist for the National Association of Realtors (NAR), discussed the state of today’s housing market.
  • When addressing whether or not today’s high buyer competition and rising home prices are evidence of a housing bubble, Yun said that this “is not a bubble. It is simply lack of supply.”
  • Today’s housing market is healthy, and rising prices are driven by real buyer demand. Let’s connect to talk about the best ways to navigate such an energetic market.

Contact us:
PHP Houses
142 W Lakeview Ave
Unit 1030
Lake Mary, FL 32746
Ph: (407) 519-0719
Fax: (407) 205-1951
email: info@phphouses.com

Let’s Connect:
Facebook
Linkedin
Twitter
Instagram

THE INFORMATION PRESENTED IN THIS ARTICLE IS FOR EDUCATIONAL PURPOSES ONLY AND SHOULD NOT BE CONSIDERED LEGAL, FINANCIAL, OR AS ANY OTHER TYPE.