During the Great Recession, just over a decade ago, the financial systems the world depended on started to collapse. It created a panic that drove some large companies out of business (ex. Lehman Brothers) and many more into bankruptcy.
The financial crisis that accompanied the current pandemic caused hardship to certain industries and hurt many small businesses. However, it hasn’t rattled the world economy. It seems that a year later, things are slowly getting back to normal for many companies.
Why is there a drastic difference between 2008 and now?
“We changed the rules. We told banks they needed more reserves and that they could no longer underwrite toxic mortgages. It turns out that regulation — properly done — can help us navigate financial minefields.”
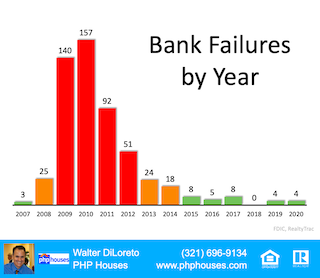
Here are the results of that regulation, captured in a graph depicting the number of failed banks since 2007.
What was different this time?
The post mentioned above explains:
“In 2008 the government saw the foreclosure meltdown as a top-down problem and set aside $700 billion for banks under the Troubled Asset Relief Program (TARP). Not all of the $700 billion was used, but the important point is that the government did not act with equal fervor to help flailing homeowners, millions of whom lost their homes to foreclosures and short sales.
This time around the government forcefully moved to help ordinary citizens. Working from the bottom-up, an estimated $5.3 trillion went to the public in 2020 through such mechanisms as the Paycheck Protection Program (PPP), expanded unemployment benefits, tax incentives, and help for local governments. So far this year we have the $1.9 billion American Rescue Plan with millions of $1,400 checks as well as proposals to spend trillions more on infrastructure…Bank deposits increased by nearly $2 trillion during the past year and credit card debt fell.”
Bottom Line
Many have suffered over the past year. However, the economic toll of the current recession was nowhere near the scope of the Great Recession, and it won’t result in a housing crisis.
Contact us:
PHP Houses
142 W Lakeview Ave
Unit 1030
Lake Mary, FL 32746
Ph: (407) 519-0719
Fax: (407) 205-1951
email: info@phphouses.com
Last March, many involved in the residential housing industry feared the market would be crushed under the pressure of a once-in-a-lifetime pandemic. Instead, real estate had one of its best years ever. Home sales and prices were both up substantially over the year before. 2020 was so strong that many now fear the market’s exuberance mirrors that of the last housing boom and, as a result, we’re now headed for another crash.
However, there are many reasons this real estate market is nothing like 2008. Here are six visuals to show the dramatic differences.
1. Mortgage standards are nothing like they were back then.
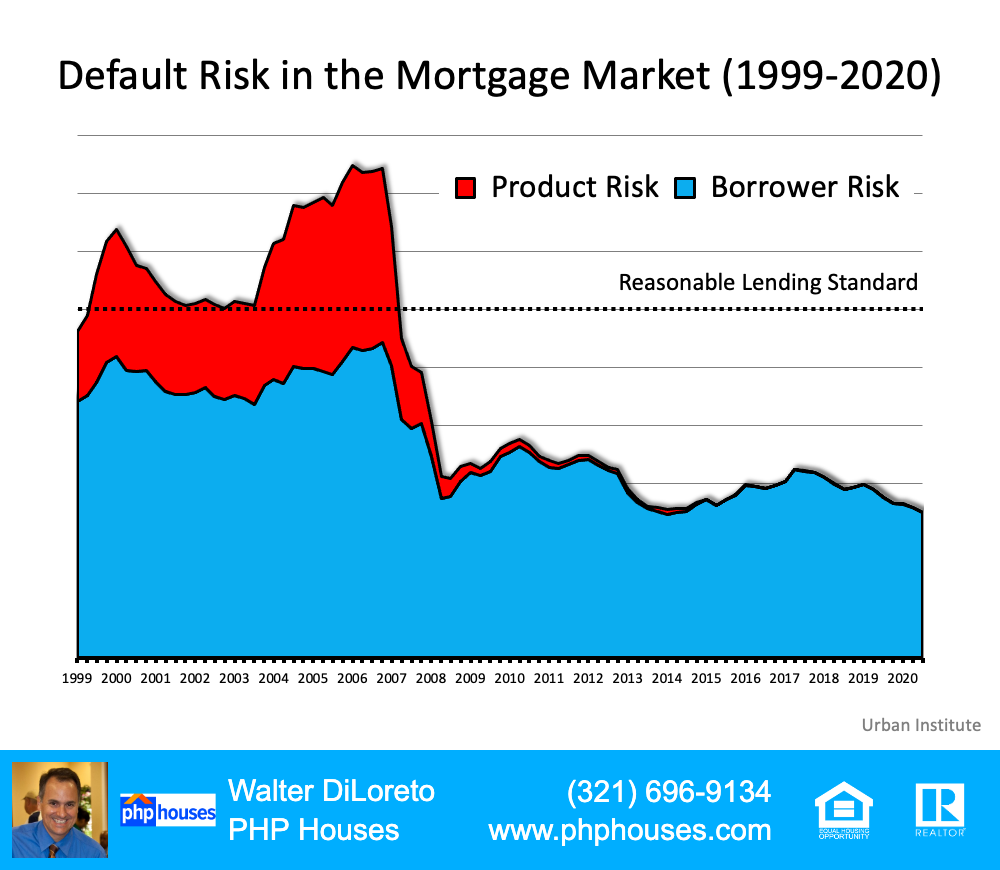
During the housing bubble, it was difficult not to get a mortgage. Today, it’s tough to qualify. Recently, the Urban Institute released their latest Housing Credit Availability Index (HCAI) which “measures the percentage of owner-occupied home purchase loans that are likely to default—that is, go unpaid for more than 90 days past their due date. A lower HCAI indicates that lenders are unwilling to tolerate defaults and are imposing tighter lending standards, making it harder to get a loan. A higher HCAI indicates that lenders are willing to tolerate defaults and are taking more risks, making it easier to get a loan.”
The index shows that lenders were comfortable taking on high levels of risk during the housing boom of 2004-2006. It also reveals that today, the HCAI is under 5 percent, which is the lowest it’s been since the introduction of the index. The report explains:
“Significant space remains to safely expand the credit box. If the current default risk was doubled across all channels, risk would still be well within the pre-crisis standard of 12.5 percent from 2001 to 2003 for the whole mortgage market.”
This is nothing like the last time.
2. Prices aren’t soaring out of control.
Below is a graph showing annual home price appreciation over the past four years compared to the four years leading up to the height of the housing bubble. Though price appreciation was quite strong last year, it’s nowhere near the rise in prices that preceded the crash.
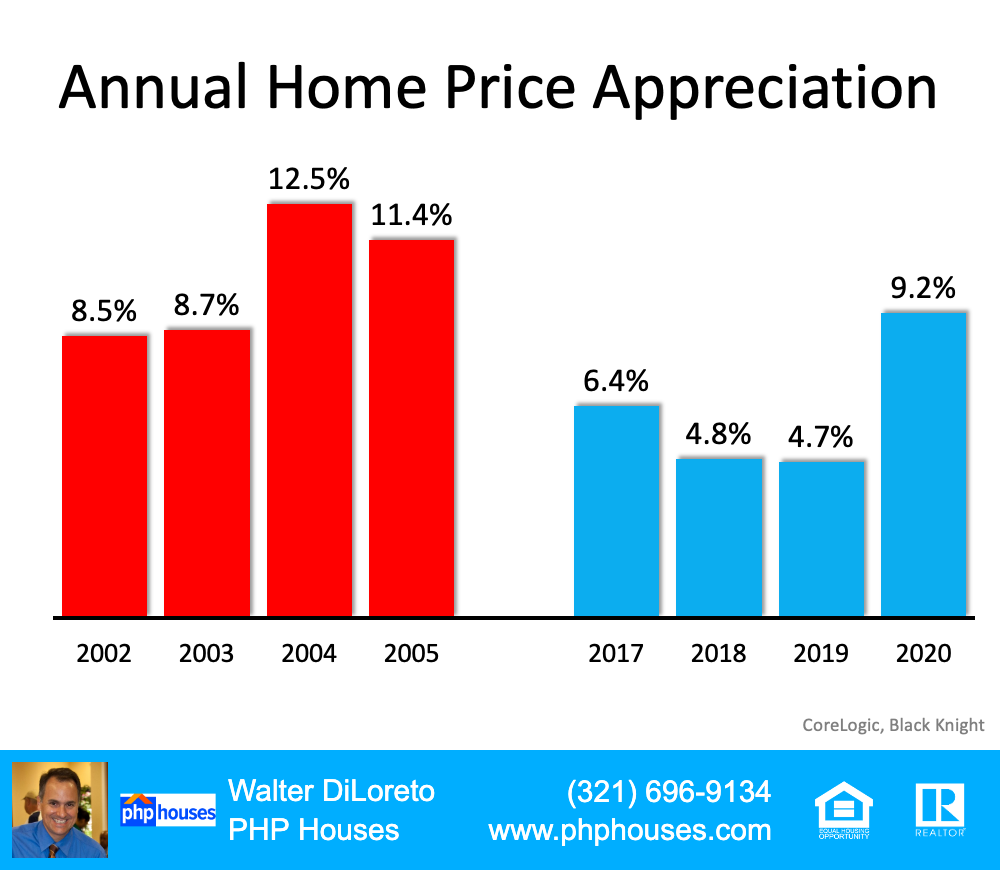
There’s a stark difference between these two periods of time. Normal appreciation is 3.8%. So, while current appreciation is higher than the historic norm, it’s certainly not accelerating out of control as it did in the early 2000s.
This is nothing like the last time.
3. We don’t have a surplus of homes on the market. We have a shortage.
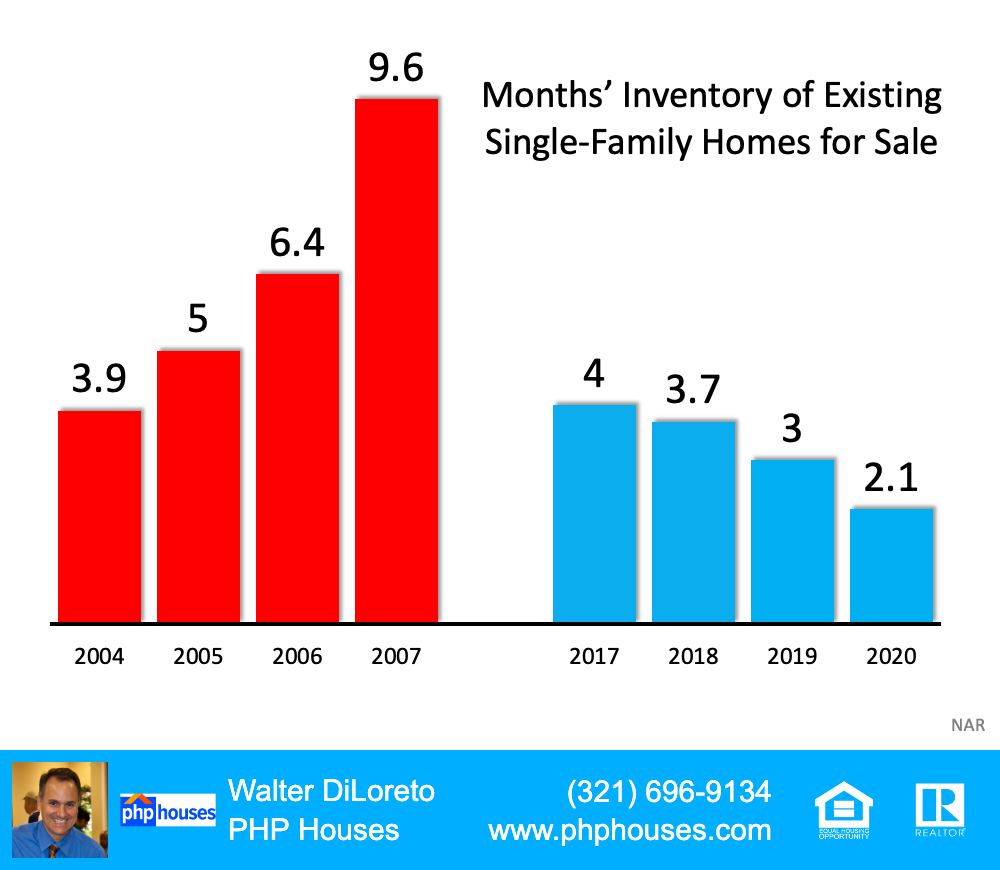
The months’ supply of inventory needed to sustain a normal real estate market is approximately six months. Anything more than that is an overabundance and will causes prices to depreciate. Anything less than that is a shortage and will lead to continued appreciation. As the next graph shows, there were too many homes for sale in 2007, and that caused prices to tumble. Today, there’s a shortage of inventory, which is causing an acceleration in home values.
This is nothing like the last time.
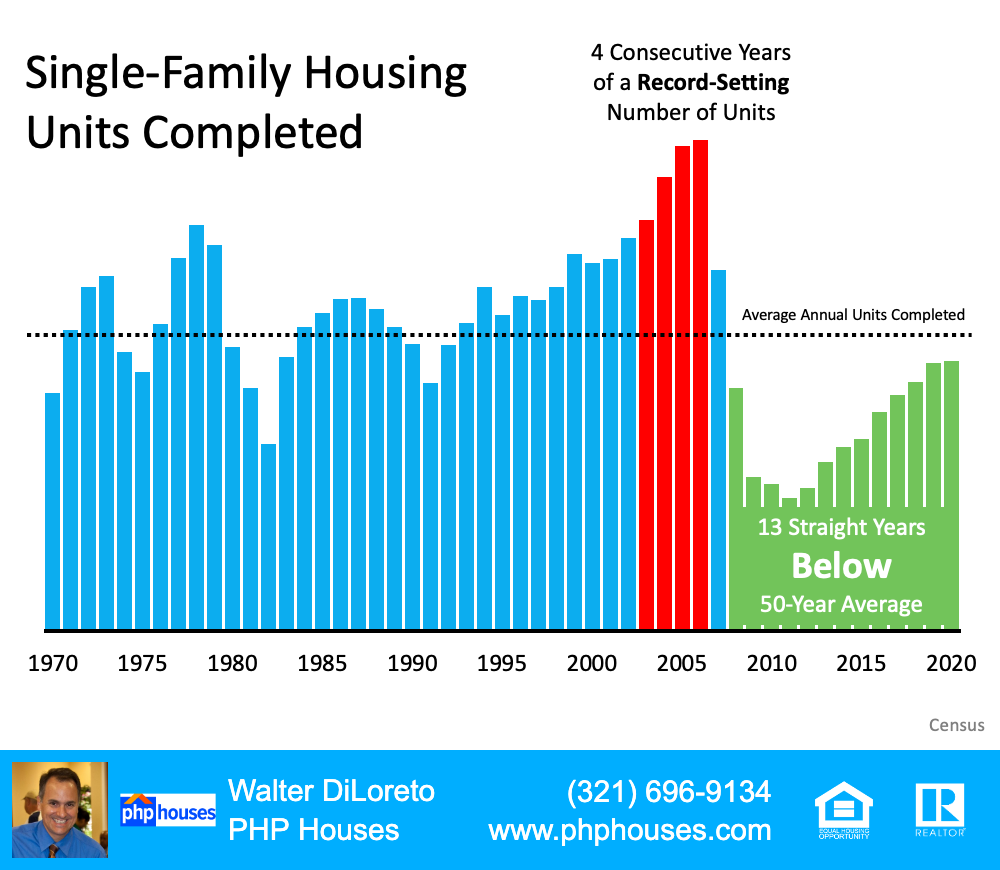
4. New construction isn’t making up the difference in inventory needed.
Some may think new construction is filling the void. However, if we compare today to right before the housing crash, we can see that an overabundance of newly built homes was a major challenge then, but isn’t now.
This is nothing like the last time.
5. Houses aren’t becoming too expensive to buy.
The affordability formula has three components: the price of the home, the wages earned by the purchaser, and the mortgage rate available at the time. Fifteen years ago, prices were high, wages were low, and mortgage rates were over 6%. Today, prices are still high. Wages, however, have increased, and the mortgage rate is about 3%. That means the average homeowner pays less of their monthly income toward their mortgage payment than they did back then. Here’s a chart showing that difference:
As Mark Fleming, Chief Economist for First American, explains:
“Lower mortgage interest rates and rising incomes correspond with higher house prices as home buyers can afford to borrow and buy more. If housing is appropriately valued, house-buying power should equal or outpace the median sale price of a home. Looking back at the bubble years, house prices exceeded house-buying power in 2006, but today house-buying power is nearly twice as high as the median sale price nationally.”
This is nothing like the last time.
6. People are equity rich, not tapped out.
In the run-up to the housing bubble, homeowners were using their homes as personal ATM machines. Many immediately withdrew their equity once it built up, and they learned their lesson in the process. Prices have risen nicely over the last few years, leading to over 50% of homes in the country having greater than 50% equity – and owners have not been tapping into it like the last time. Here’s a table comparing the equity withdrawal over the last three years compared to 2005, 2006, and 2007. Homeowners have cashed out almost $500 billion dollars less than before:
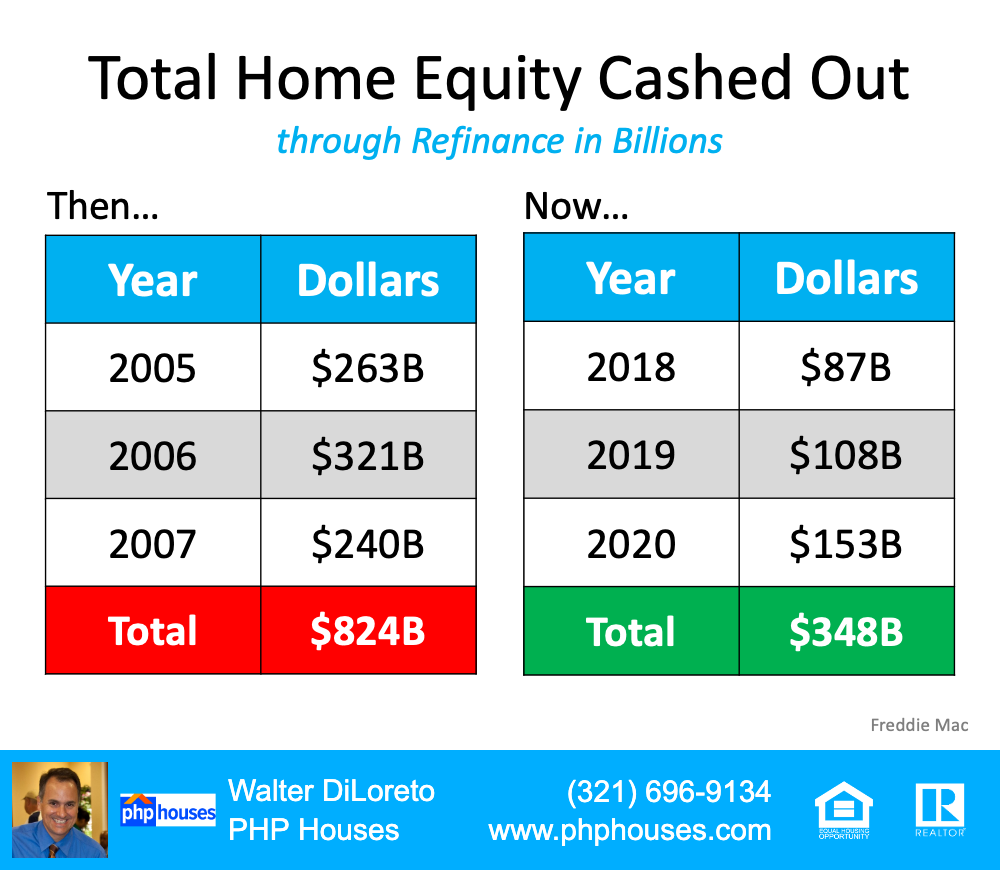
During the crash, home values began to fall, and sellers found themselves in a negative equity situation (where the amount of the mortgage they owed was greater than the value of their home). Some decided to walk away from their homes, and that led to a wave of distressed property listings (foreclosures and short sales), which sold at huge discounts, thus lowering the value of other homes in the area. With the average home equity now standing at over $190,000, this won’t happen today.
This is nothing like the last time.
Bottom Line
If you’re concerned that we’re making the same mistakes that led to the housing crash, take a look at the charts and graphs above to help alleviate your fears.
Contact us:
PHP Houses
142 W Lakeview Ave
Unit 1030
Lake Mary, FL 32746
Ph: (407) 519-0719
Fax: (407) 205-1951
email: info@phphouses.com
Earlier this month, realtor.com announced the release of their initial Housing Recovery Index, a weekly guide showing how the pandemic has impacted the residential real estate market. The index leverages a weighted average of four key components of the housing industry, tracking each of the following:
Housing Demand – Growth in online search activity
Home Price – Growth in asking prices
Housing Supply – Growth of new listings
Pace of Sales – Difference in time-on-market
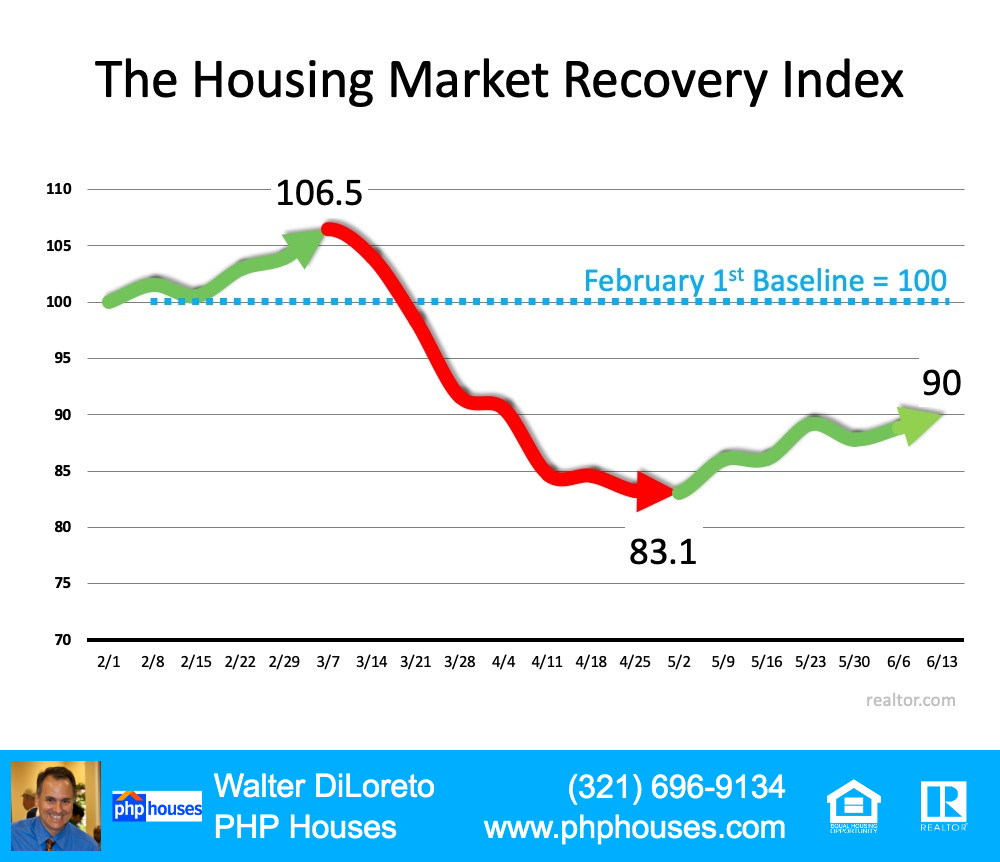
The index then compares the current status “to the last week of January 2020 market trend, as a baseline for pre-COVID market growth. The overall index is set to 100 in this baseline period. The higher a market’s index value, the higher its recovery and vice versa.”
The graph below charts the index by showing how the real estate market started out strong in early 2020, and then dropped dramatically at the beginning of March when the pandemic paused the economy. It also shows the strength of the recovery since the beginning of May.
It’s clear to see that the housing market is showing promising signs of recovery from the deep economic cuts we experienced earlier this spring. As noted by Dean Mon, Chairman of the National Association of Home Builders (NAHB):
“As the nation reopens, housing is well-positioned to lead the economy forward.”
The data today indicates the housing market is already on the way up.
Bottom Line
Staying connected to the housing market’s performance over the coming months will be essential, as we continue to evaluate exactly how the housing market is doing in this uncharted time ahead.
Contact us:
PHP Houses
142 W Lakeview Ave
Unit 1030
Lake Mary, FL 32746
Ph: (407) 519-0719
Fax: (407) 205-1951
email: info@phphouses.com
THE INFORMATION PRESENTED IN THIS ARTICLE IS FOR EDUCATIONAL PURPOSES ONLY AND SHOULD NOT BE CONSIDERED LEGAL, FINANCIAL, OR AS ANY OTHER TYPE OF ADVICE.
On Monday, the National Bureau of Economic Research (NBER) announced that the U.S. economy is officially in a recession. This did not come as a surprise to many and people may thought it could lead to a housing crash, as the Bureau defines a recession this way:
“A recession is a significant decline in economic activity spread across the economy, normally visible in production, employment, and other indicators. A recession begins when the economy reaches a peak of economic activity and ends when the economy reaches its trough. Between trough and peak, the economy is in an expansion.”
Everyone realizes that the pandemic shut down the country earlier this year, causing a “significant decline in economic activity.”
Though not surprising, headlines announcing the country is in a recession will cause consumers to remember the devastating impact the last recession had on the housing market just over a decade ago.
The real estate market, however, is in a totally different position than it was then. As Mark Fleming, Chief Economist at First American, explained:
“Many still bear scars from the Great Recession and may expect the housing market to follow a similar trajectory in response to the coronavirus outbreak. But, there are distinct differences that indicate the housing market may follow a much different path. While housing led the recession in 2008-2009, this time it may be poised to bring us out of it.”
Four major differences in today’s real estate market are:
We must also realize that a recession does not mean a housing crash will follow. In three of the four previous recessions prior to 2008, home values increased. In the other one, home prices depreciated by only 1.9%.
Bottom Line
Yes, we are now officially in a recession. However, unlike 2008, this time the housing industry is in much better shape to weather the storm.
Contact us:
PHP Houses
142 W Lakeview Ave
Unit 1030
Lake Mary, FL 32746
Ph: (407) 519-0719
Fax: (407) 205-1951
email: info@phphouses.com
THE INFORMATION PRESENTED IN THIS ARTICLE IS FOR EDUCATIONAL PURPOSES ONLY AND SHOULD NOT BE CONSIDERED LEGAL, FINANCIAL, OR AS ANY OTHER TYPE OF ADVICE.
Last Friday, the Bureau of Labor Statistics (BLS) released its latest jobs report. It revealed that the economic shutdown made necessary by COVID-19 caused the unemployment rate to jump to 14.7%. Many anticipate that next month the percentage could be even higher. These numbers represent the extreme hardship so many families are experiencing right now. That pain should not be understated. However, the long-term toll the pandemic will cause should not be overstated either. There have been numerous headlines claiming the current disruption in the economy is akin to the Great Depression, and many of those articles are calling for total Armageddon. Some experts are stepping up to refute those claims. In a Wall Street Journal (WSJ) article this past weekend, Josh Zumbrun, a national economics correspondent for the Journal explained:
“News stories often describe the coronavirus-induced global economic downturn as the worst since the Great Depression…the comparison does more to terrify than clarify.”
Zumbrun goes on to explain:
“From 1929 to 1933, the economy shrank for 43 consecutive months, according to contemporaneous estimates. Unemployment climbed to nearly 25% before slowly beginning its descent, but it remained above 10% for an entire decade…This time, many economists believe a rebound could begin this year or early next year.”
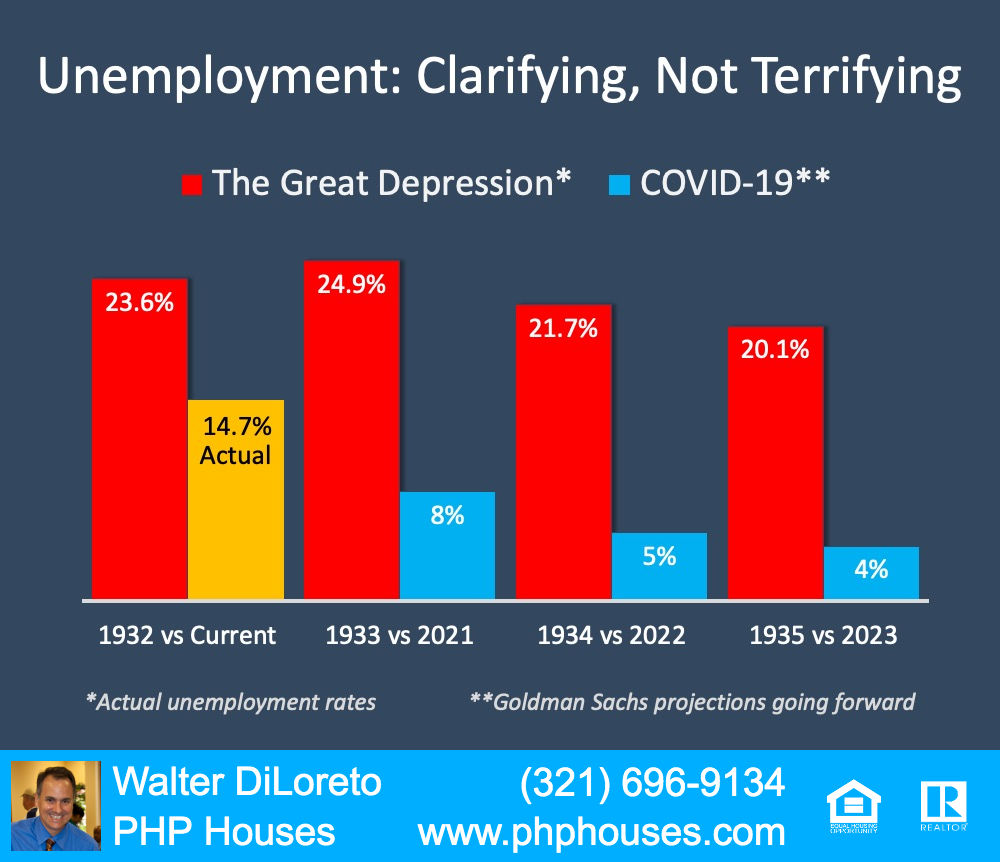
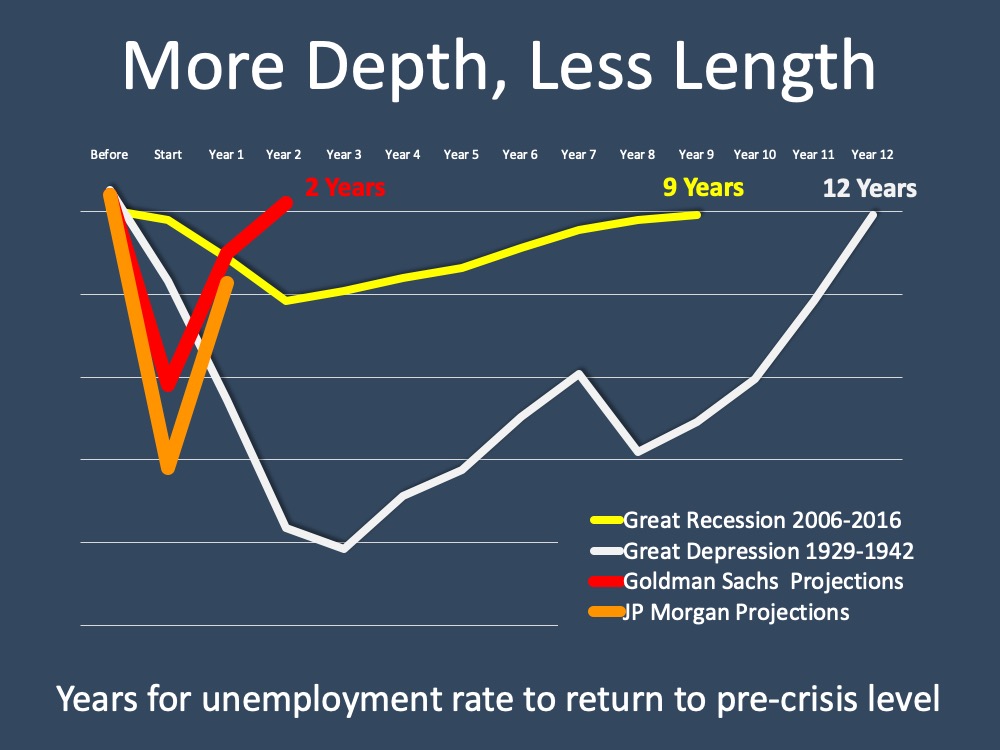
Here is a graph comparing current unemployment numbers (actual and projected) to those during the Great Depression:
Clearly, the two unemployment situations do not compare.
What makes this time so different?
This was not a structural collapse of the economy, but instead a planned shutdown to help mitigate the virus. Once the virus is contained, the economy will immediately begin to recover. This is nothing like what happened in the 1930s. In the same WSJ article mentioned above, former Federal ReserveChairman Ben Bernanke, who has done extensive research on the depression in the 1930s, explained:
“The breakdown of the financial system was a major reason for both the Great Depression and the 2007-09 recession.” He went on to say that today – “the banks are stronger and much better capitalized.”
What about the families and small businesses that are suffering right now?
The nation’s collective heart goes out to all. The BLS report, however, showed that ninety percent of the job losses are temporary. In addition, many are getting help surviving this pause in their employment status. During the Great Depression, there were no government-sponsored unemployment insurance or large government subsidies as there are this time. Today, many families are receiving unemployment benefits and an additional $600 a week. The stimulus package is helping many companies weather the storm. Is there still pain? Of course. The assistance, however, is providing much relief until most can go back to work.
Bottom Line
We should look at the current situation for what it is – a predetermined pause placed on the economy. The country will recover once the pandemic ends. Comparisons to any other downturn make little sense. Bernanke put it best:
“I don’t find comparing the current downturn with the Great Depression to be very helpful. The expected duration is much less, and the causes are very different.”
Contact us:
PHP Houses
142 W Lakeview Ave
Unit 1030
Lake Mary, FL 32746
Ph: (407) 519-0719
Fax: (407) 205-1951
email: info@phphouses.com
THE INFORMATION PRESENTED IN THIS ARTICLE IS FOR EDUCATIONAL PURPOSES ONLY AND SHOULD NOT BE CONSIDERED LEGAL, FINANCIAL, OR AS ANY OTHER TYPE OF ADVICE.
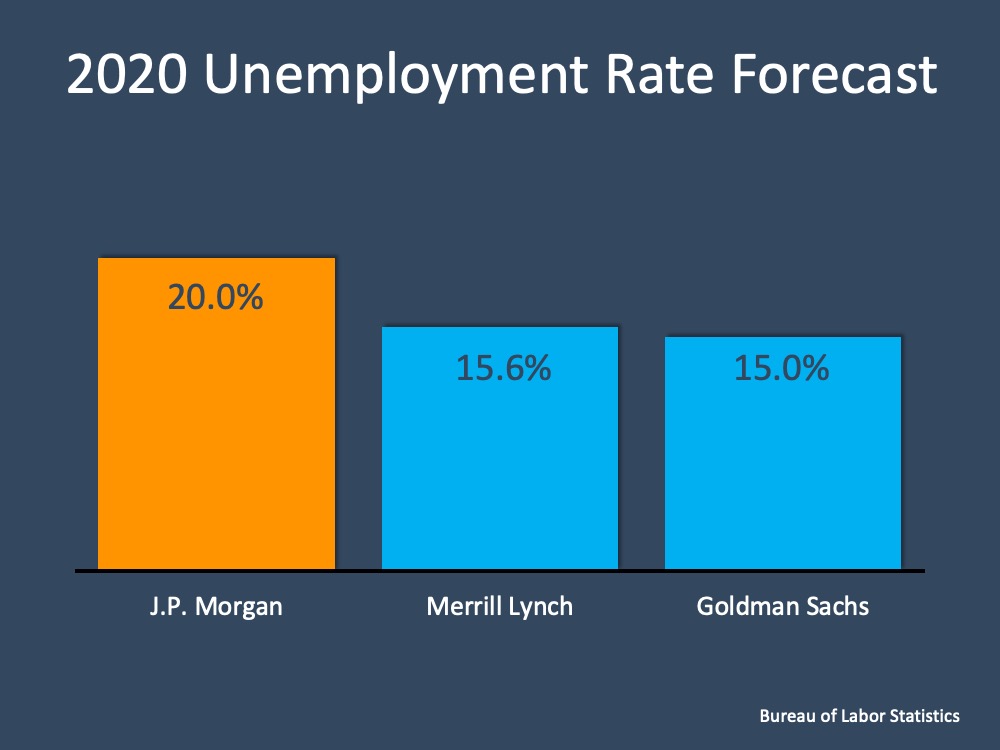
Tomorrow, the unemployment rate for April 2020 will be released by the U.S. Bureau of Labor Statistics. It will hit a peak this country has never seen before, with data representing real families and lives affected by this economic slowdown. The numbers will alarm us. There will be headlines and doomsday scenarios in the media. There is hope, though, that as businesses reopen, most people will become employed again soon. Last month’s report indicated we initially lost over 700,000 jobs in this country, and the unemployment rate quickly rose to 4.4%. With the release of the new data, that number will climb even higher. Experts forecast this report will show somewhere between a 15% – 20% national unemployment rate, and some anticipate that number to be even greater (see graph below):
What’s happened over the last several weeks?
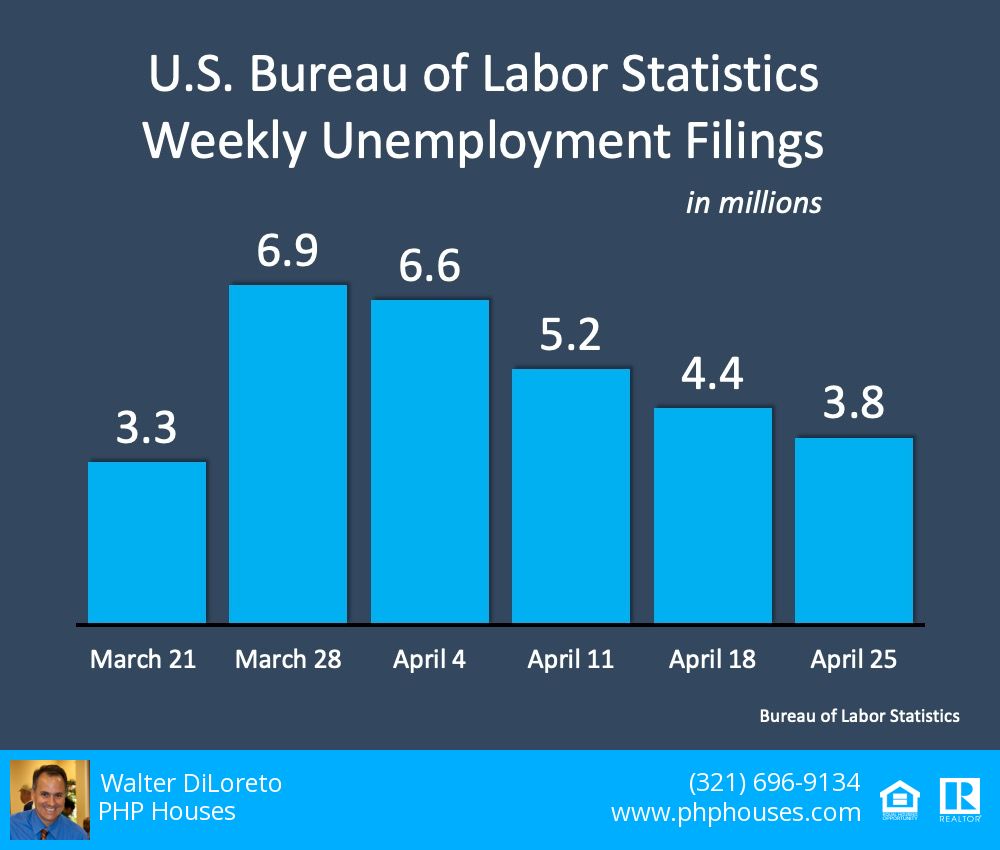
Here’s a breakdown of this spring’s weekly unemployment filings:
The good news shown here indicates the number of additional unemployment claims has decreased week over week since the beginning of April. Carlos Rodriguez, CEO of Automatic Data Processing (ADP) says based on what he’s seeing:
“It’s possible that companies are already anticipating some kind of normalization, opening in certain states and starting to post jobs.”
He goes on to say that this doesn’t mean all companies are hiring, but it could mean they are at the point where they’re not cutting jobs anymore. Let’s hope this trend continues.
What will the future bring?
Most experts predict that while unemployment is high right now, it won’t be that way for long. The length of unemployment during this crisis is projected to be significantly shorter than the duration seen in the Great Recession and the Great Depression.
While forecasts may be high, the numbers are trending down and the length of time isn’t expected to last forever.
Bottom Line
Don’t let the headlines rattle you. There’s hope coming as we start to safely reopen businesses throughout the country. Unemployment affects our families, our businesses, and our country. Our job is to rally around those impacted and do our part to support them through this time.
Contact us:
PHP Houses
142 W Lakeview Ave
Unit 1030
Lake Mary, FL 32746
Ph: (407) 519-0719
Fax: (407) 205-1951
email: info@phphouses.com
THE INFORMATION PRESENTED IN THIS ARTICLE IS FOR EDUCATIONAL PURPOSES ONLY AND SHOULD NOT BE CONSIDERED LEGAL, FINANCIAL, OR AS ANY OTHER TYPE OF ADVICE.
Business science, health science, and social science all influence the projections we’re hearing from economic experts right now. Let’s connect to discuss the latest insights and how they may impact our local market.
Contact us:
PHP Houses
142 W Lakeview Ave
Unit 1030
Lake Mary, FL 32746
Ph: (407) 519-0719
Fax: (407) 205-1951
email: info@phphouses.com
THE INFORMATION PRESENTED IN THIS ARTICLE IS FOR EDUCATIONAL PURPOSES ONLY AND SHOULD NOT BE CONSIDERED LEGAL, FINANCIAL, OR AS ANY OTHER TYPE OF ADVICE.
With businesses starting to slowly open back up again in some parts of the country, it’s important to understand how housing can have a major impact on the recovery of the U.S. economy. As we’ve mentioned before, buying a home is a driving financial force in this process. Today, many analysts believe one of the first things we’ll be able to safely bring back is the home building sector, creating more jobs and impacting local neighborhoods in a big way. According to Robert Dietz in The Eye on Housing:
“The pace of new home sales will post significant declines during the second quarter due to the impacts of higher unemployment and shutdown effects of much of the U.S. economy, including elements of the real estate sector in certain markets. However, given the momentum housing construction held at the start of 2020, the housing industry will help lead the economy in the eventual recovery.”
The National Association of Home Builders (NAHB) notes the impact new construction can have on the job market:
“Building 1,000 average single-family homes creates 2,900 full-time jobs and generates $110.96 million in taxes and fees for all levels of government to support police, firefighters and schools, according to NAHB’s National Impact of Home Building and Remodeling report.”
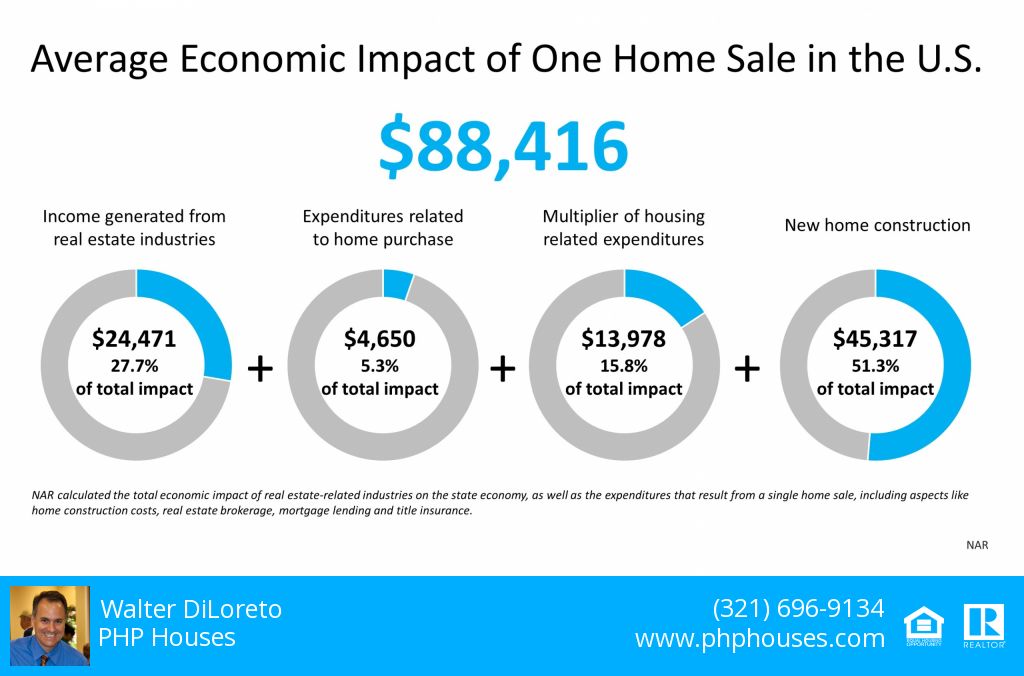
These employment opportunities, along with the home purchase, drive the economy in a major way. The National Association of Realtors (NAR) recently shared a report that notes the full economic impact of home sales. This report summarizes:
“The total economic impact of real estate related industries on the state economy, as well as the expenditures that result from a single home sale, including aspects like home construction costs, real estate brokerage, mortgage lending and title insurance.”
Here’s the breakdown of how the average home sale boosts the economy:
As noted above in the circle on the right, the impact is almost double when you purchase new construction, given the sheer number of workers it requires to design, build, equip, and finalize the sale of the home. The NAHB paints a clear picture of these roles:
“The NAHB model shows that job creation through housing is broad-based. Building new homes and apartments generates jobs in industries that produce lumber, concrete, lighting fixtures, heating equipment and other products that go into a home remodeling project. Other jobs are generated in the process of transporting, storing and selling these products. Additional jobs are generated for professionals such as architects, engineers, real estate agents, lawyers and accountants who provide services to home builders, home buyers and remodelers.”
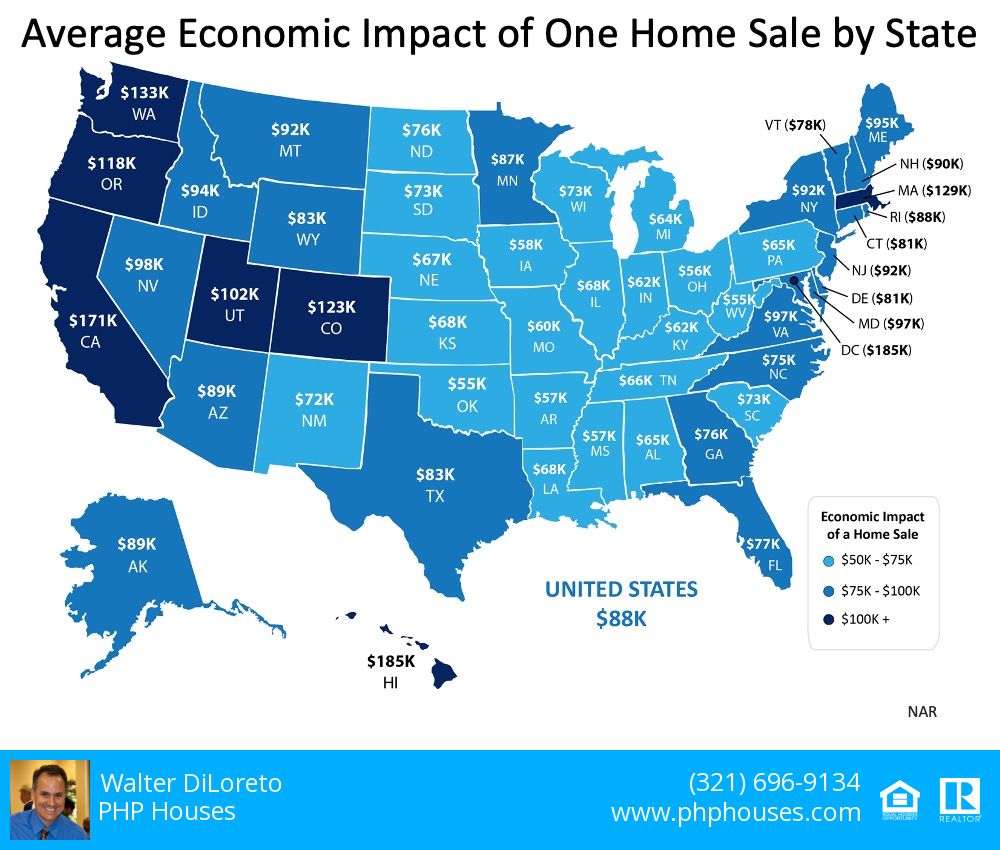
The same NAR report also breaks down the average economic impact by state:
On an emotional level, what’s most important for today’s consumers to feel confident about is the safety component that goes into the process. Mitigating the risk of essential personnel at this moment in time is more crucial than ever as we all aim to reduce the spread of the coronavirus. Fortunately, the NAHB has put immense effort into a plan that prioritizes the health and safety of home builders and contractors:
“This is why NAHB and construction industry partners have developed a Coronavirus Preparedness and Response Plan specifically tailored to construction job sites. The plan is customizable and covers areas that include manager and worker responsibilities, job site protective measures, cleaning and disinfecting, responding to exposure incidents, and OSHA record-keeping requirements.”
Bottom Line
Buying a home is a substantial economic driver today, and when new construction picks back up again, it will be an even stronger recovery force throughout the country. If you’re in a position to buy a home this year, you can have a significant impact on your local neighborhoods and safely make the move you’ve been waiting for. It’s a win-win.
Contact us:
PHP Houses
142 W Lakeview Ave
Unit 1030
Lake Mary, FL 32746
Ph: (407) 519-0719
Fax: (407) 205-1951
email: info@phphouses.com
THE INFORMATION PRESENTED IN THIS ARTICLE IS FOR EDUCATIONAL PURPOSES ONLY AND SHOULD NOT BE CONSIDERED LEGAL, FINANCIAL, OR AS ANY OTHER TYPE OF ADVICE.
Technology is the driving force behind many of today’s real estate transactions. Let’s connect to discuss how working together to go digital can give you an edge when buying or selling your home.
Contact us:
PHP Houses
142 W Lakeview Ave
Unit 1030
Lake Mary, FL 32746
Ph: (407) 519-0719
Fax: (407) 205-1951
email: info@phphouses.com
THE INFORMATION PRESENTED IN THIS ARTICLE IS FOR EDUCATIONAL PURPOSES ONLY AND SHOULD NOT BE CONSIDERED LEGAL, FINANCIAL, OR AS ANY OTHER TYPE OF ADVICE.
A big challenge facing the housing industry is determining what impact the current pandemic may have on home values. Some buyers are hoping for major price reductions because the health crisis is straining the economy.
The price of any item, however, is determined by supply and demand, which is how many items are available in relation to how many consumers want to buy that item.
In residential real estate, the measurement used to decipher that ratio is called months supply of inventory. A normal market would have 6-7 months of inventory. Anything over seven months would be considered a buyers’ market, with downward pressure on prices. Anything under six months would indicate a sellers’ market, which would put upward pressure on prices.
Going into March of this year, the supply stood at three months – a strong seller’s market. While buyer demand has decreased rather dramatically during the pandemic, the number of homes on the market has also decreased. The recently released Existing Home Sales Report from the National Association of Realtors (NAR) revealed we currently have 3.4 months of inventory. This means homes should maintain their value during the pandemic.
This information is consistent with the research completed by John Burns Real Estate Consulting, which recently reported:
“Historical analysis showed us that pandemics are usually V-shaped (sharp recessions that recover quickly enough to provide little damage to home prices).”
What are the experts saying?
Here’s a look at what some experts recently reported on the matter:
“Supported by our analysis of home price dynamics through cycles and other periods of economic and housing disruption, we expect home price appreciation to decelerate from current levels in 2020, though easily remain in positive territory year over year given the beneficial factors of record-low inventories & a historically-low interest rate environment.”
“The fiscal stimulus provided by the CARES Act will mute the impact that the economic shock has on house prices. Additionally, forbearance and foreclosure mitigation programs will limit the fire sale contagion effect on house prices. We forecast house prices to fall 0.5 percentage points over the next four quarters. Two forces prevent a collapse in house prices. First, as we indicated in our earlier research report, U.S. housing markets face a large supply deficit. Second, population growth and pent up household formations provide a tailwind to housing demand. Price growth accelerates back towards a long-run trend of between 2 and 3% per year.”
THE INFORMATION PRESENTED IN THIS ARTICLE IS FOR EDUCATIONAL PURPOSES ONLY AND SHOULD NOT BE CONSIDERED LEGAL, FINANCIAL, OR AS ANY OTHER TYPE OF ADVICE.